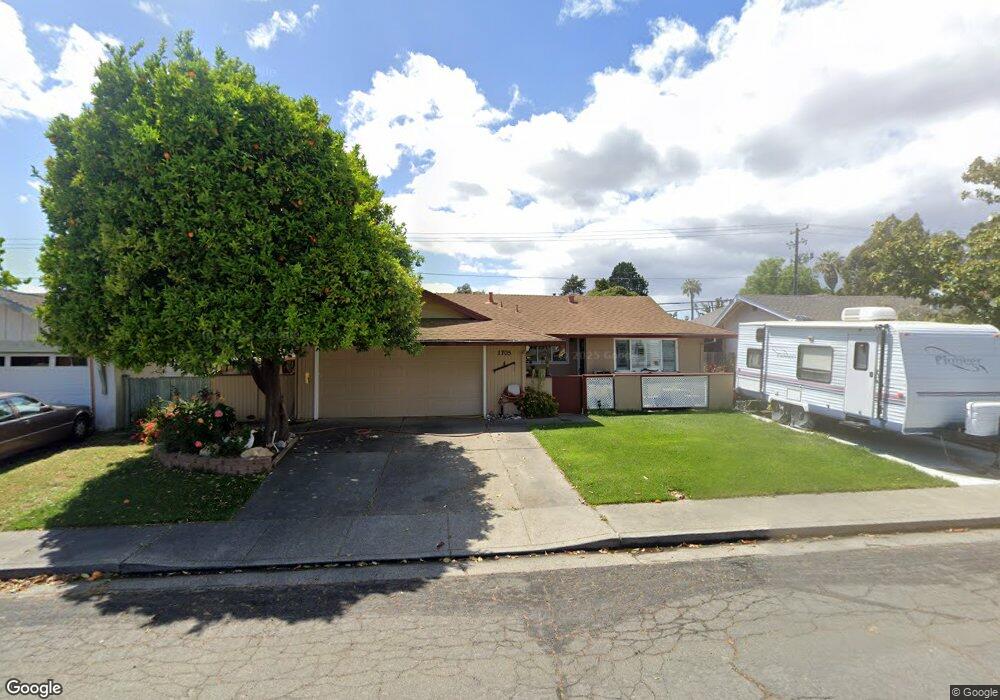
1705 Hemlock St Fairfield, CA 94533
Estimated Value: $494,000 - $509,000
3
Beds
2
Baths
1,643
Sq Ft
$305/Sq Ft
Est. Value
About This Home
This home is located at 1705 Hemlock St, Fairfield, CA 94533 and is currently estimated at $501,510, approximately $305 per square foot. 1705 Hemlock St is a home located in Solano County with nearby schools including Anna Kyle Elementary School, Grange Middle School, and Fairfield High School.
Ownership History
Date
Name
Owned For
Owner Type
Purchase Details
Closed on
Jul 9, 2020
Sold by
Carr James S
Bought by
Carr James S and The James S Carr Revocable Tru
Current Estimated Value
Purchase Details
Closed on
Oct 22, 2008
Sold by
Aurora Loan Services Llc
Bought by
Carr James S
Home Financials for this Owner
Home Financials are based on the most recent Mortgage that was taken out on this home.
Original Mortgage
$189,992
Interest Rate
6.47%
Mortgage Type
FHA
Purchase Details
Closed on
Jun 13, 2008
Sold by
Bautista Angelica and Gonzalez David
Bought by
Aurora Loan Services Llc
Purchase Details
Closed on
Oct 10, 2006
Sold by
Tower Dolores M
Bought by
Gonzales David and Bautista Angelica
Home Financials for this Owner
Home Financials are based on the most recent Mortgage that was taken out on this home.
Original Mortgage
$85,000
Interest Rate
6.14%
Mortgage Type
Stand Alone Second
Create a Home Valuation Report for This Property
The Home Valuation Report is an in-depth analysis detailing your home's value as well as a comparison with similar homes in the area
Home Values in the Area
Average Home Value in this Area
Purchase History
| Date | Buyer | Sale Price | Title Company |
|---|---|---|---|
| Carr James S | -- | None Available | |
| Carr James S | $192,500 | Lsi Title Fnds Division | |
| Aurora Loan Services Llc | $333,500 | None Available | |
| Gonzales David | $425,000 | North American Title Co |
Source: Public Records
Mortgage History
| Date | Status | Borrower | Loan Amount |
|---|---|---|---|
| Previous Owner | Carr James S | $189,992 | |
| Previous Owner | Gonzales David | $85,000 | |
| Previous Owner | Gonzales David | $340,000 |
Source: Public Records
Tax History
| Year | Tax Paid | Tax Assessment Tax Assessment Total Assessment is a certain percentage of the fair market value that is determined by local assessors to be the total taxable value of land and additions on the property. | Land | Improvement |
|---|---|---|---|---|
| 2025 | $2,705 | $247,882 | $64,380 | $183,502 |
| 2024 | $2,705 | $243,022 | $63,118 | $179,904 |
| 2023 | $2,621 | $238,258 | $61,881 | $176,377 |
| 2022 | $2,588 | $233,587 | $60,668 | $172,919 |
| 2021 | $2,561 | $229,008 | $59,479 | $169,529 |
| 2020 | $2,500 | $226,661 | $58,870 | $167,791 |
| 2019 | $2,438 | $222,217 | $57,716 | $164,501 |
| 2018 | $2,514 | $217,861 | $56,585 | $161,276 |
| 2017 | $2,397 | $213,590 | $55,476 | $158,114 |
| 2016 | $2,373 | $209,403 | $54,389 | $155,014 |
| 2015 | $2,215 | $206,259 | $53,573 | $152,686 |
| 2014 | $2,193 | $202,220 | $52,524 | $149,696 |
Source: Public Records
Map
Nearby Homes
- 1831 Clay St
- 1724 Fillmore St
- 219 Wisconsin St
- 1712 Arthur Ct
- 1661 Fairfield Ave
- 751 Hillcrest Ct
- 1500 Harrison St
- 1667 Vicksburg Dr
- 1217 Dana Dr
- 133 E Travis Blvd
- 736 Nevada St
- 1669 Rutledge Ln
- 1660 Glenmore Dr
- 1652 Glenmore Dr
- 1812 San Jose Place
- 2034 Cambridge Dr
- 519 Pacific Ave
- 1541 Rayburn Ct
- 366 San Andreas St
- 937 Pacific Ave
- 1701 Hemlock St
- 1711 Hemlock St
- 1661 Hemlock St
- 1717 Hemlock St
- 1706 Hemlock St
- 1700 Hemlock St
- 1712 Hemlock St
- 1723 Hemlock St
- 1655 Hemlock St
- 1660 Hemlock St
- 1718 Hemlock St
- 1724 Hemlock St
- 1729 Hemlock St
- 1654 Hemlock St
- 1719 Elm St
- 1711 Elm St
- 1725 Elm St
- 512 Sycamore Dr
- 1730 Hemlock St Unit B
- 1735 Hemlock St
Your Personal Tour Guide
Ask me questions while you tour the home.