Estimated Value: $1,054,299 - $1,319,000
4
Beds
2
Baths
1,611
Sq Ft
$744/Sq Ft
Est. Value
About This Home
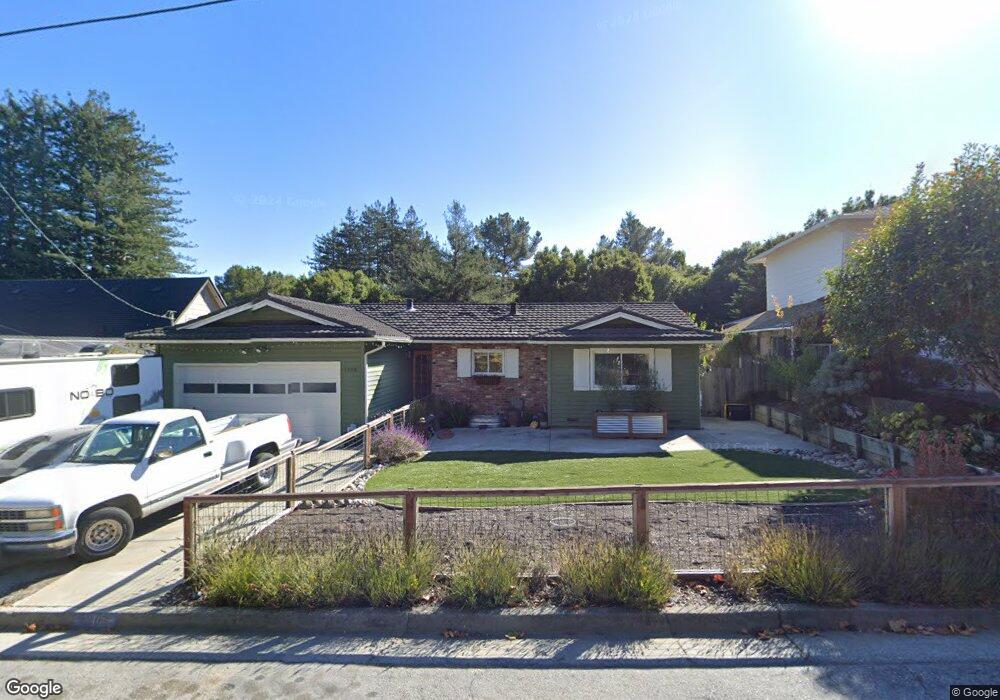
This home is located at 1705 Wilshire Dr, Aptos, CA 95003 and is currently estimated at $1,198,825, approximately $744 per square foot. 1705 Wilshire Dr is a home located in Santa Cruz County with nearby schools including Mar Vista Elementary School, Aptos Junior High School, and Aptos High School.
Ownership History
Date
Name
Owned For
Owner Type
Purchase Details
Closed on
Jun 23, 2015
Sold by
Rosinger Janelle
Bought by
Rosinger Janelle Kristin and Rosinger Kristy Jean
Current Estimated Value
Purchase Details
Closed on
Oct 1, 2014
Sold by
Rosa Tanya C
Bought by
Rosinger Janelle
Purchase Details
Closed on
Nov 8, 2012
Sold by
Rosa Tanya C and Smith Family Trust
Bought by
Rosa Tanya C
Purchase Details
Closed on
Feb 2, 2005
Sold by
Smith Dorrell K and Smith Bettye C
Bought by
Smith Dorrell K and Smith Bettye C
Home Financials for this Owner
Home Financials are based on the most recent Mortgage that was taken out on this home.
Original Mortgage
$80,500
Interest Rate
5.79%
Mortgage Type
New Conventional
Create a Home Valuation Report for This Property
The Home Valuation Report is an in-depth analysis detailing your home's value as well as a comparison with similar homes in the area
Home Values in the Area
Average Home Value in this Area
Purchase History
| Date | Buyer | Sale Price | Title Company |
|---|---|---|---|
| Rosinger Janelle Kristin | -- | None Available | |
| Rosinger Janelle | -- | None Available | |
| Rosa Tanya C | -- | None Available | |
| Smith Dorrell K | -- | First American Title Ins Co | |
| Smith Dorrell K | -- | First American Title Ins Co |
Source: Public Records
Mortgage History
| Date | Status | Borrower | Loan Amount |
|---|---|---|---|
| Previous Owner | Smith Dorrell K | $80,500 |
Source: Public Records
Tax History
| Year | Tax Paid | Tax Assessment Tax Assessment Total Assessment is a certain percentage of the fair market value that is determined by local assessors to be the total taxable value of land and additions on the property. | Land | Improvement |
|---|---|---|---|---|
| 2025 | $2,416 | $93,858 | $19,253 | $74,605 |
| 2023 | $2,311 | $90,213 | $18,505 | $71,708 |
| 2022 | $2,221 | $88,444 | $18,142 | $70,302 |
| 2021 | $2,037 | $86,710 | $17,787 | $68,923 |
| 2020 | $1,988 | $85,821 | $17,604 | $68,217 |
| 2019 | $1,949 | $84,138 | $17,259 | $66,879 |
| 2018 | $1,885 | $82,489 | $16,921 | $65,568 |
| 2017 | $1,853 | $80,871 | $16,589 | $64,282 |
| 2016 | $1,820 | $79,286 | $16,264 | $63,022 |
| 2015 | $1,749 | $78,095 | $16,020 | $62,075 |
| 2014 | $1,697 | $76,565 | $15,706 | $60,859 |
Source: Public Records
Map
Nearby Homes
- 2979 Mar Vista Dr Unit 102
- 2831 Casa de Vida Dr
- 49 Greco St Unit 49
- 2711 Mar Vista Dr Unit 15
- Lot 02 Cathedral Dr
- 785 Cathedral Dr
- 625 Quail Run Rd
- 6247 Cabot Ct
- 3069 Arlington Dr
- 3006 Atherton Dr
- 000 Burns Ave
- 2921 Crocker Ct
- 3015 Arlington Dr
- 532 Moonrise Ln
- 230 Rosemarie Ct
- 530 Quail Run Rd
- 522 Spruce St
- 836 Seacliff Dr
- 2623 Willowbrook Ln Unit 118
- 6125 Abbey Rd
- 1691 Wilshire Dr
- 1719 Wilshire Dr
- 1733 Wilshire Dr
- 1677 Wilshire Dr
- 1710 Wilshire Dr
- 1698 Wilshire Dr
- 1726 Wilshire Dr
- 1684 Wilshire Dr
- 1751 Wilshire Dr
- 1665 Wilshire Dr
- 145 Riviera Dr
- 1738 Wilshire Dr
- 1664 Wilshire Dr
- 129 Riviera Dr
- 1674 Cheryl Way
- 1752 Wilshire Dr
- 1686 Cheryl Way
- 1650 Wilshire Dr
- 1660 Cheryl Way
- 1700 Cheryl Way
Your Personal Tour Guide
Ask me questions while you tour the home.