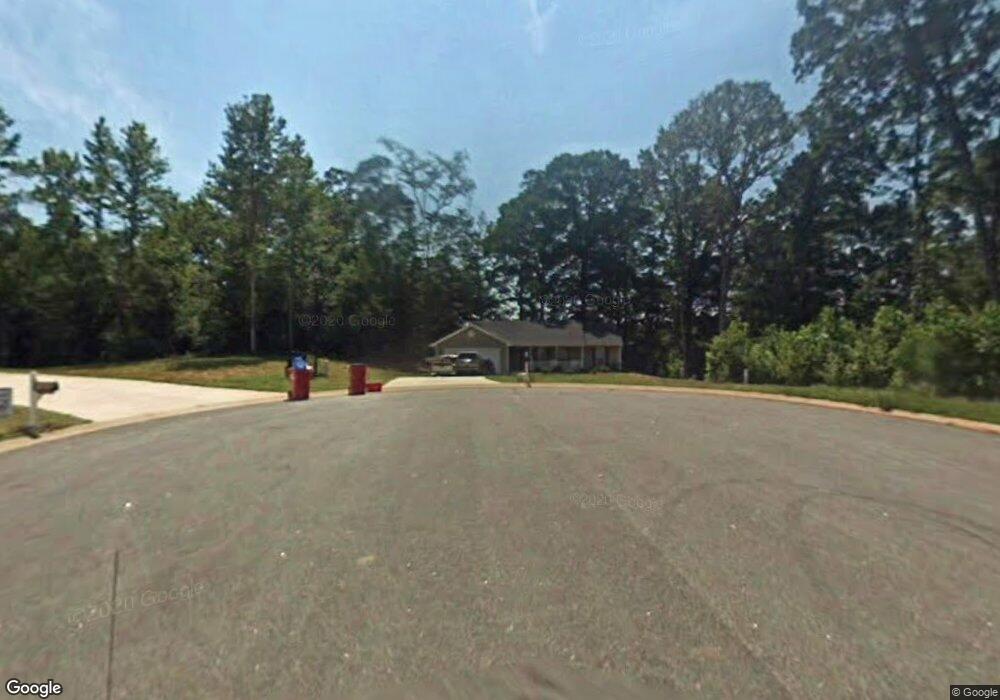
1706 Bismarck Cir Winder, GA 30680
Estimated Value: $309,915 - $328,000
3
Beds
2
Baths
1,355
Sq Ft
$234/Sq Ft
Est. Value
About This Home
This home is located at 1706 Bismarck Cir, Winder, GA 30680 and is currently estimated at $316,729, approximately $233 per square foot. 1706 Bismarck Cir is a home located in Barrow County with nearby schools including Statham Elementary School, Bear Creek Middle School, and Winder-Barrow High School.
Ownership History
Date
Name
Owned For
Owner Type
Purchase Details
Closed on
Nov 2, 2009
Sold by
Peoples Bk & Trust
Bought by
Dawson Daniel
Current Estimated Value
Home Financials for this Owner
Home Financials are based on the most recent Mortgage that was taken out on this home.
Original Mortgage
$112,400
Interest Rate
5.04%
Mortgage Type
New Conventional
Purchase Details
Closed on
Mar 27, 2009
Sold by
Hartley Megan C
Bought by
Peoples Bank & Trust
Purchase Details
Closed on
Jul 19, 2007
Sold by
Hkb Inc
Bought by
Southfork Hms Inc
Purchase Details
Closed on
Mar 30, 2007
Sold by
Hkb Inc
Bought by
Southfork Homes Inc
Purchase Details
Closed on
Jul 25, 2002
Bought by
Hkb Inc
Create a Home Valuation Report for This Property
The Home Valuation Report is an in-depth analysis detailing your home's value as well as a comparison with similar homes in the area
Home Values in the Area
Average Home Value in this Area
Purchase History
| Date | Buyer | Sale Price | Title Company |
|---|---|---|---|
| Dawson Daniel | $119,900 | -- | |
| Peoples Bank & Trust | $123,900 | -- | |
| Southfork Hms Inc | $105,000 | -- | |
| Southfork Homes Inc | $210,000 | -- | |
| Hkb Inc | -- | -- |
Source: Public Records
Mortgage History
| Date | Status | Borrower | Loan Amount |
|---|---|---|---|
| Closed | Dawson Daniel | $112,400 |
Source: Public Records
Tax History Compared to Growth
Tax History
| Year | Tax Paid | Tax Assessment Tax Assessment Total Assessment is a certain percentage of the fair market value that is determined by local assessors to be the total taxable value of land and additions on the property. | Land | Improvement |
|---|---|---|---|---|
| 2024 | $2,470 | $96,202 | $26,800 | $69,402 |
| 2023 | $2,299 | $89,292 | $25,200 | $64,092 |
| 2022 | $2,110 | $70,314 | $18,000 | $52,314 |
| 2021 | $2,062 | $64,816 | $18,000 | $46,816 |
| 2020 | $1,878 | $58,551 | $16,000 | $42,551 |
| 2019 | $1,910 | $58,551 | $16,000 | $42,551 |
| 2018 | $1,717 | $52,886 | $14,000 | $38,886 |
| 2017 | $1,242 | $42,662 | $14,000 | $28,662 |
| 2016 | $1,313 | $40,113 | $14,000 | $26,113 |
| 2015 | $1,328 | $40,389 | $14,000 | $26,389 |
| 2014 | $1,155 | $33,526 | $6,860 | $26,666 |
| 2013 | -- | $34,686 | $6,860 | $27,826 |
Source: Public Records
Map
Nearby Homes
- 113 Platte St
- 207 Cedar Grove Church Rd
- 670 Cedar Grove Church Rd
- 670 Cedar Grove Church Rd
- 1724 Cedar Grove Church Rd
- 1431 Solomon Dr
- 1453 Solomon Dr
- 1023 Solomon Ct
- 385 Finch Landing Rd
- 212 Rainbow Ln
- 51 Brockton Way Unit 2
- 144 Briar Rose Blvd
- 1415 Red Oak Way
- 3845 S Highway 82
- 1914 Hearthstone Ct
- 1642 White Oak Dr
- 2081 Ethridge Rd
- 0 Berch Tree Trail Unit LOT 12
- 0 Berch Tree Trail Unit LOT 7
- 0 Berch Tree Trail Unit 7665580
- 1704 Bismarck Cir
- 1705 Bismarck Cir
- 1700 Bismarck Cir
- 1703 Bismarck Cir
- 1698 Bismarck Cir Unit Ga1254
- 1698 Bismarck Cir Unit GA12544
- 119 Platte St
- 114 Platte St
- 1697 Bismarck Cir
- 112 Platte St
- 1696 Bismarck Cir
- 1696 Bismarck Cir Unit 38
- 0 Platte St Unit 7331027
- 0 Platte St Unit 7268870
- 0 Platte St Unit 3289406
- 0 Platte St Unit 8320488
- 0 Platte St
- 1695 Bismarck Cir
- 111 Platte St
- 1693 Bismarck Cir