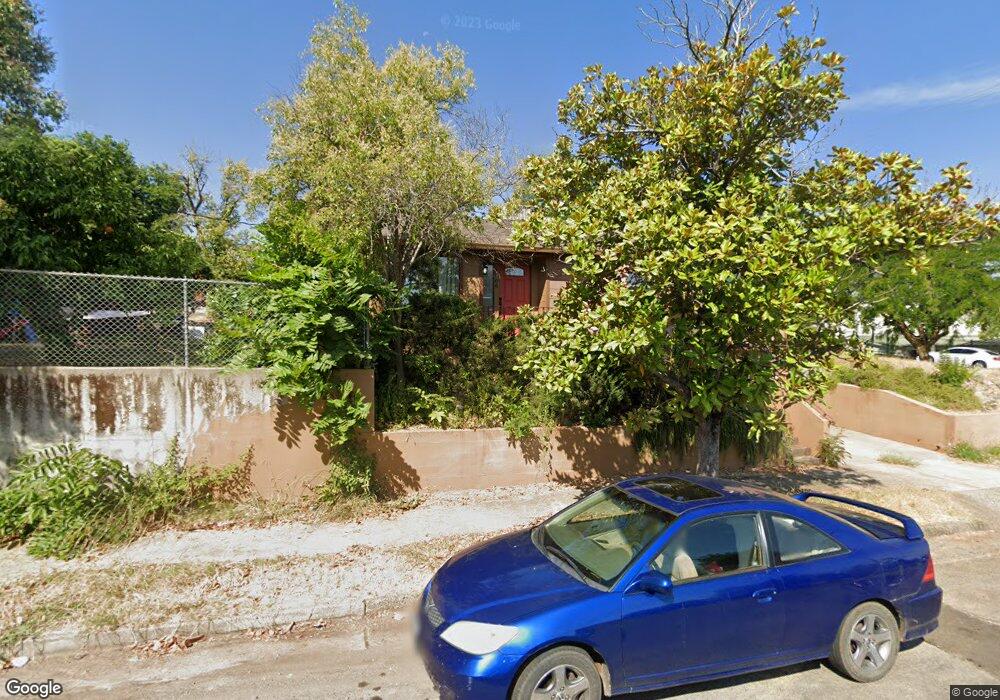
1706 Magnolia Ave Unit 1 Redding, CA 96001
Magnolia NeighborhoodEstimated Value: $250,000 - $349,000
4
Beds
2
Baths
1,236
Sq Ft
$254/Sq Ft
Est. Value
About This Home
This home is located at 1706 Magnolia Ave Unit 1, Redding, CA 96001 and is currently estimated at $314,190, approximately $254 per square foot. 1706 Magnolia Ave Unit 1 is a home located in Shasta County with nearby schools including Manzanita Elementary School, Sequoia Middle School, and Shasta High School.
Ownership History
Date
Name
Owned For
Owner Type
Purchase Details
Closed on
Mar 10, 2015
Sold by
Berkey Theodore A and Berkey Nancy R
Bought by
Theodore A & Nancy R Berkey Revocable Tr
Current Estimated Value
Purchase Details
Closed on
Jan 13, 2012
Sold by
Sharpe Michael G
Bought by
Berkey Theodore A and Berkey Nancy R
Purchase Details
Closed on
Jul 30, 2009
Sold by
Sharpe Cynthia D
Bought by
Sharpe Michael G
Purchase Details
Closed on
Apr 6, 2005
Sold by
Sharpe Michael G
Bought by
Sharpe Michael G and Sharpe Cynthia D
Purchase Details
Closed on
Mar 13, 2001
Sold by
Sharpe Wilbur G and Sharpe Barbara
Bought by
Sharpe Michael G
Purchase Details
Closed on
Mar 12, 1997
Sold by
Ann Mathews Kathy
Bought by
Sharpe Wilbur G and Sharpe Barbara
Create a Home Valuation Report for This Property
The Home Valuation Report is an in-depth analysis detailing your home's value as well as a comparison with similar homes in the area
Home Values in the Area
Average Home Value in this Area
Purchase History
| Date | Buyer | Sale Price | Title Company |
|---|---|---|---|
| Theodore A & Nancy R Berkey Revocable Tr | -- | None Available | |
| Berkey Theodore A | $56,000 | National Title Insurance Of | |
| Sharpe Michael G | -- | Placer Title Company | |
| Sharpe Michael G | -- | -- | |
| Sharpe Michael G | $80,000 | -- | |
| Sharpe Wilbur G | $74,500 | First American Title Co |
Source: Public Records
Tax History Compared to Growth
Tax History
| Year | Tax Paid | Tax Assessment Tax Assessment Total Assessment is a certain percentage of the fair market value that is determined by local assessors to be the total taxable value of land and additions on the property. | Land | Improvement |
|---|---|---|---|---|
| 2025 | $1,543 | $146,948 | $37,676 | $109,272 |
| 2024 | $1,520 | $144,068 | $36,938 | $107,130 |
| 2023 | $1,520 | $141,244 | $36,214 | $105,030 |
| 2022 | $1,494 | $138,475 | $35,504 | $102,971 |
| 2021 | $1,486 | $135,760 | $34,808 | $100,952 |
| 2020 | $1,505 | $134,369 | $34,452 | $99,917 |
| 2019 | $1,429 | $131,735 | $33,777 | $97,958 |
| 2018 | $1,442 | $129,153 | $33,115 | $96,038 |
| 2017 | $1,434 | $126,621 | $32,466 | $94,155 |
| 2016 | $1,389 | $124,139 | $31,830 | $92,309 |
| 2015 | $1,371 | $122,275 | $31,352 | $90,923 |
| 2014 | $1,362 | $119,880 | $30,738 | $89,142 |
Source: Public Records
Map
Nearby Homes
- 2176 Placer St
- 1545 Olive Ave
- 1764 Chestnut St
- 2180 Oak Ridge Dr
- 1310 Olive St
- 2235 Tehama St
- 1901 Chestnut St
- 1575 Fig Ave
- 2381/2401 West St
- 2330 West St
- 925 & 927 Magnolia Ave
- 1259 1261 Magnolia Ave
- 2254 Crestview Ave
- 1144 Willis St
- 1170 Orange Ave
- 2760 Shasta St
- 2415 West St
- 1191 Hillcrest Place
- 2123 Waldon St
- 2429 Court St
- 1706 Magnolia Ave
- 2225 Placer St
- 1728 Magnolia Ave
- 2235 Placer St
- 1742 Magnolia Ave
- 2255 Placer St
- 2245 Placer St
- 1756 Magnolia Ave
- 2164 Placer St
- 2168 Placer St
- 1759 Magnolia Ave
- 2145 Placer St
- 2265 Placer St
- 2160 Placer St
- 1643 Magnolia Ave
- 1776 Magnolia Ave
- 1777 Magnolia Ave
- 2146 Placer St
- 2135 Placer St Unit 1
- 2135 Placer St