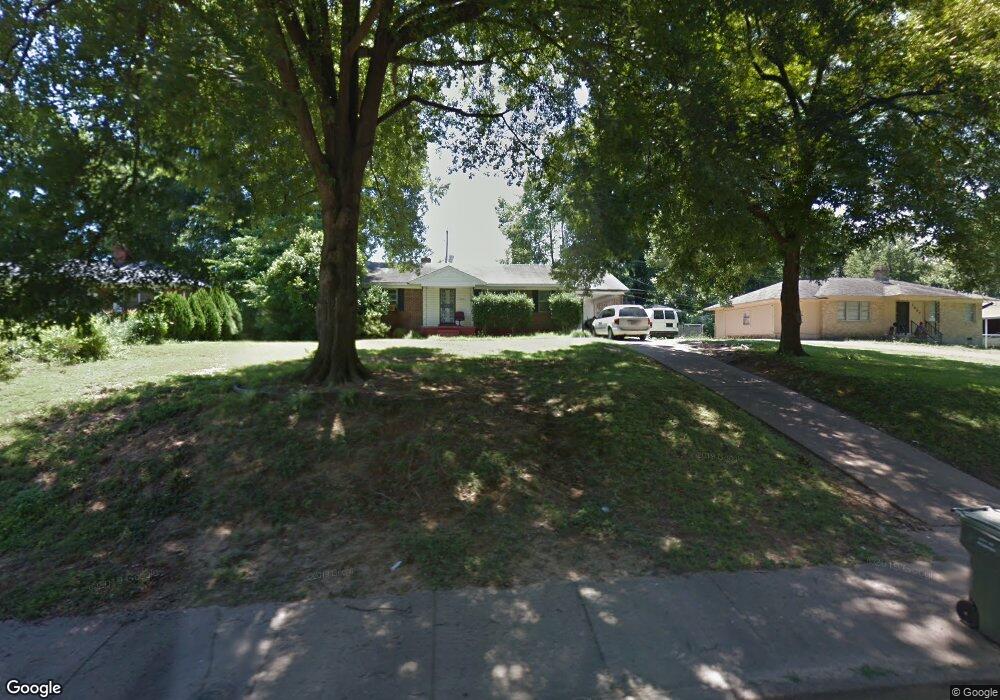
1707 Gregory Ave Memphis, TN 38127
Frayser NeighborhoodEstimated Value: $94,148 - $117,000
2
Beds
1
Bath
1,430
Sq Ft
$75/Sq Ft
Est. Value
About This Home
This home is located at 1707 Gregory Ave, Memphis, TN 38127 and is currently estimated at $107,787, approximately $75 per square foot. 1707 Gregory Ave is a home located in Shelby County with nearby schools including Grandview Heights Middle, Trezevant High School, and Cornerstone Prep Denver Campus.
Ownership History
Date
Name
Owned For
Owner Type
Purchase Details
Closed on
Feb 6, 2026
Sold by
901 2 0 Llc
Bought by
Harvey Erika J
Current Estimated Value
Home Financials for this Owner
Home Financials are based on the most recent Mortgage that was taken out on this home.
Original Mortgage
$90,960
Outstanding Balance
$90,960
Interest Rate
6.16%
Mortgage Type
Credit Line Revolving
Estimated Equity
$16,827
Purchase Details
Closed on
Jun 30, 2025
Sold by
Vicoli Christopher and Vicoli Phillip
Bought by
901-2 0 Llc
Purchase Details
Closed on
May 17, 2017
Sold by
Mid South Homebyer Inc
Bought by
Vicoli Phillip and Vicoli Christopher
Home Financials for this Owner
Home Financials are based on the most recent Mortgage that was taken out on this home.
Original Mortgage
$45,750
Interest Rate
4.1%
Mortgage Type
New Conventional
Purchase Details
Closed on
Feb 24, 2017
Sold by
Mdm Investmts Of Menphis Llc
Bought by
Modsouth Homebuyers Inc
Purchase Details
Closed on
Nov 18, 2016
Sold by
The Bank Of New York Mellon
Bought by
Mdm Investments Of Memphis Llc
Purchase Details
Closed on
Jun 8, 2015
Sold by
Williams Brenda and Williams Darnell
Bought by
The Bank Of New York Mellon and The Bank Of New York
Create a Home Valuation Report for This Property
The Home Valuation Report is an in-depth analysis detailing your home's value as well as a comparison with similar homes in the area
Home Values in the Area
Average Home Value in this Area
Purchase History
| Date | Buyer | Sale Price | Title Company |
|---|---|---|---|
| Harvey Erika J | $113,700 | None Listed On Document | |
| 901-2 0 Llc | $85,000 | None Listed On Document | |
| Vicoli Phillip | $61,000 | Saddle Creek Title Llc | |
| Modsouth Homebuyers Inc | $22,500 | Baymark Title And Escrow | |
| Mdm Investments Of Memphis Llc | $11,000 | None Available | |
| The Bank Of New York Mellon | $12,580 | None Available |
Source: Public Records
Mortgage History
| Date | Status | Borrower | Loan Amount |
|---|---|---|---|
| Open | Harvey Erika J | $90,960 | |
| Previous Owner | Vicoli Phillip | $45,750 | |
| Closed | Modsouth Homebuyers Inc | $0 |
Source: Public Records
Tax History
| Year | Tax Paid | Tax Assessment Tax Assessment Total Assessment is a certain percentage of the fair market value that is determined by local assessors to be the total taxable value of land and additions on the property. | Land | Improvement |
|---|---|---|---|---|
| 2025 | $546 | $22,175 | $1,775 | $20,400 |
| 2024 | $546 | $16,100 | $1,475 | $14,625 |
| 2023 | $981 | $16,100 | $1,475 | $14,625 |
| 2022 | $981 | $16,100 | $1,475 | $14,625 |
| 2021 | $992 | $16,100 | $1,475 | $14,625 |
| 2020 | $793 | $10,950 | $1,475 | $9,475 |
| 2019 | $793 | $10,950 | $1,475 | $9,475 |
| 2018 | $793 | $10,950 | $1,475 | $9,475 |
| 2017 | $450 | $10,950 | $1,475 | $9,475 |
| 2016 | $541 | $12,375 | $0 | $0 |
| 2014 | $541 | $12,375 | $0 | $0 |
Source: Public Records
Map
Nearby Homes
- 3230 Riney St
- 3278 N Watkins St
- 3277 Ashland St
- 3293 Ashland St
- 3382 Frayser School Dr
- 3133 Vista Grande St
- 3342 Ashland St
- 1871 Thrift Ave
- 1688 Haywood Ave
- 1680 Haywood Ave
- 3359 Beechmont St
- 1863 Willow Wood Ave
- 3284 Parham St
- 3150 Parham St
- 3076 Saint Croix Place Unit 92
- 3072 Saint Croix Place Unit 91
- 3070 Saint Croix Place Unit 90
- 3055 Saint Croix Place Unit 74
- 3251 Aden St
- 2444 Frayser Blvd
- 1721 Gregory Ave
- 1697 Gregory Ave
- 1714 Childers Ave
- 1706 Childers Ave
- 1722 Childers Ave
- 1693 Gregory Ave
- 1731 Gregory Ave
- 1700 Gregory Ave
- 1720 Gregory Ave
- 1698 Childers Ave
- 1730 Childers Ave
- 1694 Gregory Ave
- 1689 Gregory Ave
- 1730 Gregory Ave
- 1690 Childers Ave
- 1741 Gregory Ave
- 1690 Gregory Ave
- 1717 Paullus Ave
- 1715 Childers Ave
- 1707 Paullus Ave
Your Personal Tour Guide
Ask me questions while you tour the home.