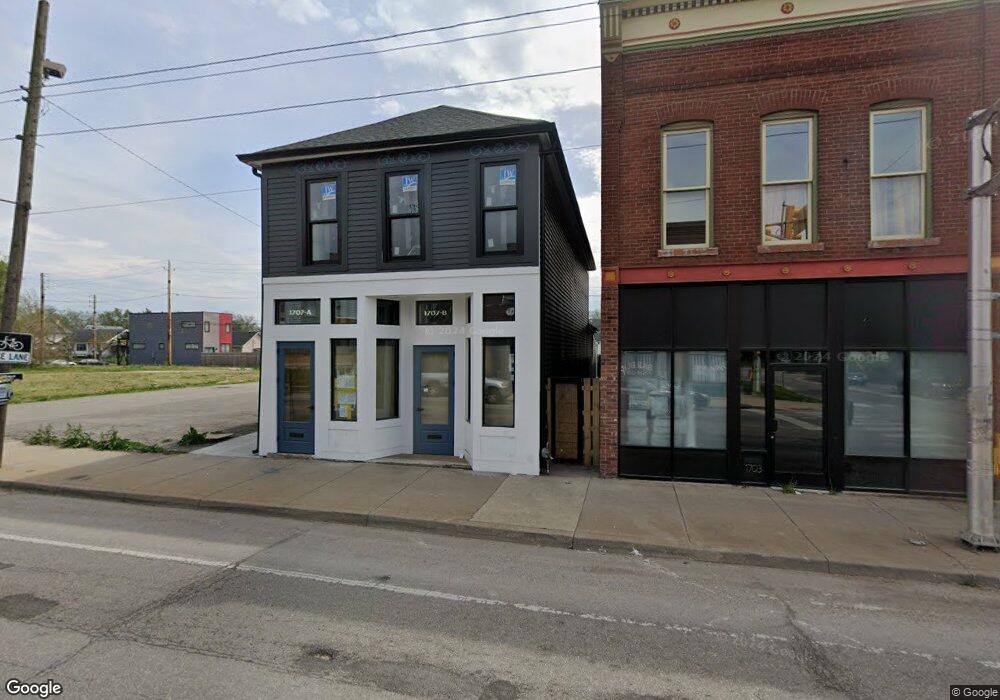
1707 Prospect St Indianapolis, IN 46203
Fountain Square NeighborhoodEstimated Value: $159,340
Studio
--
Bath
1,900
Sq Ft
$84/Sq Ft
Est. Value
About This Home
This home is located at 1707 Prospect St, Indianapolis, IN 46203 and is currently estimated at $159,340, approximately $83 per square foot. 1707 Prospect St is a home located in Marion County with nearby schools including Eleanor Skillen School No. 34, Ralph Waldo Emerson School 58, and George W. Julian School No. 57.
Ownership History
Date
Name
Owned For
Owner Type
Purchase Details
Closed on
Aug 23, 2025
Sold by
Royal Realty Llc
Bought by
Red Cardinal Llc
Current Estimated Value
Purchase Details
Closed on
Feb 27, 2023
Sold by
Red Cardinal Llc
Bought by
Royalty Realty Llc
Purchase Details
Closed on
Oct 21, 2022
Sold by
Christiana Trust
Bought by
Red Cardinal Llc
Purchase Details
Closed on
Aug 16, 2022
Sold by
Sheriff Of Marion County
Bought by
Wilmington Savings Fund Society Fsb and Northgate Redevelopment Group Llc
Purchase Details
Closed on
Mar 22, 2019
Sold by
3Ba Llc
Bought by
Northgate Redevelopment Group
Purchase Details
Closed on
Jul 13, 2018
Sold by
Jeanann Gunter
Bought by
Sahar Montalvo Manager
Purchase Details
Closed on
Oct 7, 2013
Sold by
Marc Vanderpol Pr Estate Of Jonathan C Bradle
Bought by
Gunter Jeanann
Purchase Details
Closed on
Feb 11, 2008
Sold by
Ward Raymond D
Bought by
Bradley John
Create a Home Valuation Report for This Property
The Home Valuation Report is an in-depth analysis detailing your home's value as well as a comparison with similar homes in the area
Home Values in the Area
Average Home Value in this Area
Purchase History
| Date | Buyer | Sale Price | Title Company |
|---|---|---|---|
| Red Cardinal Llc | -- | None Listed On Document | |
| Royalty Realty Llc | -- | -- | |
| Red Cardinal Llc | $140,000 | Title Clearing & Escrow | |
| Wilmington Savings Fund Society Fsb | $433,644 | Codilis Law Llc | |
| Northgate Redevelopment Group | -- | None Available | |
| Sahar Montalvo Manager | $160,000 | -- | |
| Gunter Jeanann | -- | -- | |
| Bradley John | -- | None Available |
Source: Public Records
Tax History
| Year | Tax Paid | Tax Assessment Tax Assessment Total Assessment is a certain percentage of the fair market value that is determined by local assessors to be the total taxable value of land and additions on the property. | Land | Improvement |
|---|---|---|---|---|
| 2024 | $2,669 | $104,300 | $8,000 | $96,300 |
| 2023 | $2,669 | $96,600 | $8,000 | $88,600 |
| 2022 | $3,758 | $96,600 | $8,000 | $88,600 |
| 2021 | $2,634 | $91,600 | $7,300 | $84,300 |
| 2020 | $2,639 | $91,900 | $7,300 | $84,600 |
| 2019 | $2,807 | $96,800 | $7,300 | $89,500 |
| 2018 | $2,253 | $74,100 | $7,300 | $66,800 |
| 2017 | $1,659 | $61,300 | $7,300 | $54,000 |
| 2016 | $1,514 | $58,300 | $7,300 | $51,000 |
| 2014 | $1,574 | $58,500 | $7,300 | $51,200 |
| 2013 | $1,703 | $58,500 | $7,300 | $51,200 |
Source: Public Records
Map
Nearby Homes
- 1724 Prospect St
- 1128 S State Ave
- 1133 Dawson St
- 1812 Prospect St
- 1122 Reid Place
- 1016 Dawson St
- 918 S State Ave
- 1720 Woodlawn Ave
- 1627 Pleasant St
- 1929 Prospect St
- 2013 Prospect St
- 909 Dawson St
- 2018 Prospect St
- 2027 Prospect St
- 1437 Woodlawn Ave
- 2029 Prospect St
- 1153 Villa Ave
- 2033 Prospect St
- 1524 Pleasant St
- 2041 Prospect St
- 1701 Prospect St
- 1717 Prospect St
- 1115 S State Ave
- 1119 S State Ave
- 1726 Prospect St
- 1123 S State Ave
- 1727 Prospect St
- 1702 Prospect St
- 1631 Prospect St
- 1116 Dawson St
- 1710 Prospect St
- 1127 S State Ave
- 1120 Dawson St
- 1627 Prospect St
- 1718 Prospect St
- 1714 Prospect St
- 1110 Dawson St
- 1124 Dawson St
- 1133 S State Ave
- 1720 Prospect St
Your Personal Tour Guide
Ask me questions while you tour the home.