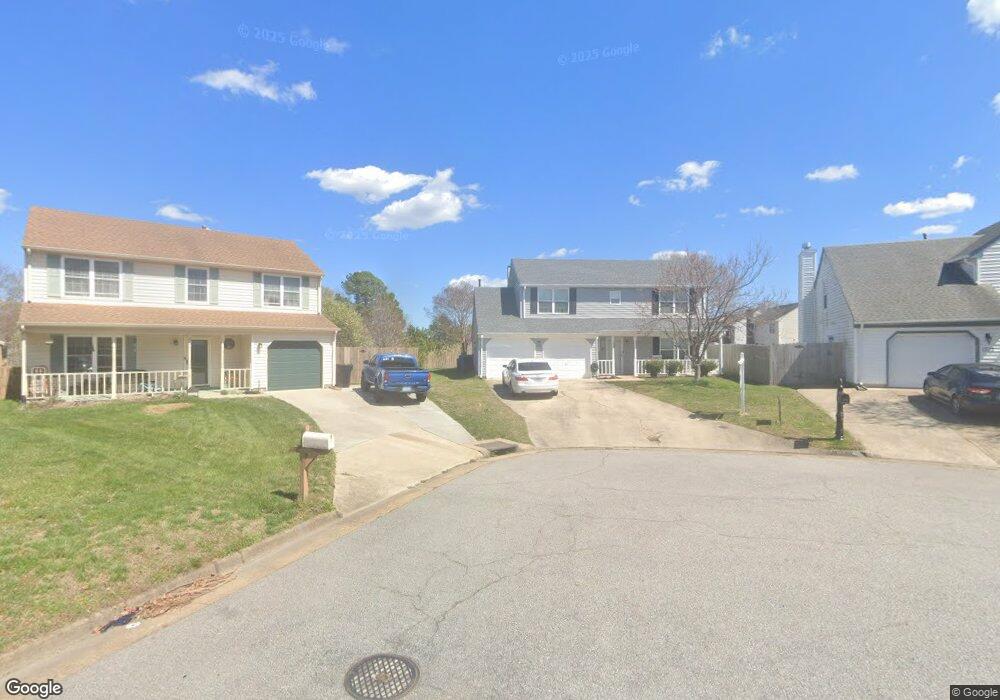
1708 Blue Lagoon Ct Unit Va Virginia Beach, VA 23456
Landstown NeighborhoodEstimated Value: $423,000 - $441,953
4
Beds
3
Baths
1,944
Sq Ft
$222/Sq Ft
Est. Value
About This Home
This home is located at 1708 Blue Lagoon Ct Unit Va, Virginia Beach, VA 23456 and is currently estimated at $431,988, approximately $222 per square foot. 1708 Blue Lagoon Ct Unit Va is a home located in Virginia Beach City with nearby schools including Salem Elementary School, Landstown Middle School, and Landstown High School.
Ownership History
Date
Name
Owned For
Owner Type
Purchase Details
Closed on
Apr 8, 2025
Sold by
Eargle Micah Alan and Eargle Jessica Nayeli
Bought by
Borchardt Niklas
Current Estimated Value
Home Financials for this Owner
Home Financials are based on the most recent Mortgage that was taken out on this home.
Original Mortgage
$379,687
Outstanding Balance
$378,037
Interest Rate
6.76%
Mortgage Type
VA
Estimated Equity
$53,951
Purchase Details
Closed on
Jul 14, 2021
Sold by
Leiby Douglas K and Leiby Lisa J
Bought by
Eargle Micah Alan and Eargle Jessica Nateli
Home Financials for this Owner
Home Financials are based on the most recent Mortgage that was taken out on this home.
Original Mortgage
$352,935
Interest Rate
2.93%
Mortgage Type
VA
Create a Home Valuation Report for This Property
The Home Valuation Report is an in-depth analysis detailing your home's value as well as a comparison with similar homes in the area
Home Values in the Area
Average Home Value in this Area
Purchase History
| Date | Buyer | Sale Price | Title Company |
|---|---|---|---|
| Borchardt Niklas | $425,000 | Fidelity National Title | |
| Eargle Micah Alan | $345,000 | Accommodation |
Source: Public Records
Mortgage History
| Date | Status | Borrower | Loan Amount |
|---|---|---|---|
| Open | Borchardt Niklas | $379,687 | |
| Previous Owner | Eargle Micah Alan | $352,935 |
Source: Public Records
Tax History Compared to Growth
Tax History
| Year | Tax Paid | Tax Assessment Tax Assessment Total Assessment is a certain percentage of the fair market value that is determined by local assessors to be the total taxable value of land and additions on the property. | Land | Improvement |
|---|---|---|---|---|
| 2025 | $3,923 | $415,900 | $134,000 | $281,900 |
| 2024 | $3,923 | $404,400 | $119,000 | $285,400 |
| 2023 | $3,871 | $391,000 | $111,000 | $280,000 |
| 2022 | $3,435 | $347,000 | $103,000 | $244,000 |
| 2021 | $2,937 | $296,700 | $91,000 | $205,700 |
| 2020 | $2,716 | $266,900 | $91,000 | $175,900 |
| 2019 | $2,666 | $260,900 | $90,000 | $170,900 |
| 2018 | $2,616 | $260,900 | $90,000 | $170,900 |
| 2017 | $2,483 | $247,700 | $90,000 | $157,700 |
| 2016 | $2,379 | $240,300 | $90,000 | $150,300 |
| 2015 | $2,386 | $241,000 | $90,000 | $151,000 |
| 2014 | $2,057 | $227,400 | $96,000 | $131,400 |
Source: Public Records
Map
Nearby Homes
- 2224 Rock Lake Loop
- 2260 Rock Lake Loop
- 1832 Jagged Rock Dr
- 1980 Aquamarine Dr
- 3900 Dupree Ln
- 1845 Rock Lake Loop
- 3868 Shooting Star Dr
- 3950 Lantana Place
- 3829 Lasalle Dr Unit 107
- The Addison Plan at Guilford at Spence Crossing
- The Rowen Plan at Guilford at Spence Crossing
- 4165 Laurel Green Cir
- 3852 Lasalle Dr Unit 101
- 5056 Heathglen Cir
- 3959 Morning View Dr
- 1720 Vankar Dr Unit 308
- 1720 Vankar Dr Unit 207
- 1720 Vankar Dr Unit 302
- 1720 Vankar Dr
- 1712 Blue Lagoon Ct
- 1704 Blue Lagoon Ct
- 2240 Rock Lake Loop
- 1716 Blue Lagoon Ct
- 1700 Blue Lagoon Ct
- 2236 Rock Lake Loop
- 1701 Blue Lagoon Ct
- 2232 Rock Lake Loop
- 1713 Blue Lagoon Ct
- 1717 Blue Lagoon Ct
- 1709 Blue Lagoon Ct
- 2228 Rock Lake Loop
- 1700 Minnows Ct
- 2201 Speckled Rock Ln
- 1809 Rapids Ct
- 1813 Rapids Ct
- 2256 Rock Lake Loop
- 1701 Minnows Ct
- 1704 Minnows Ct
- 2220 Rock Lake Loop