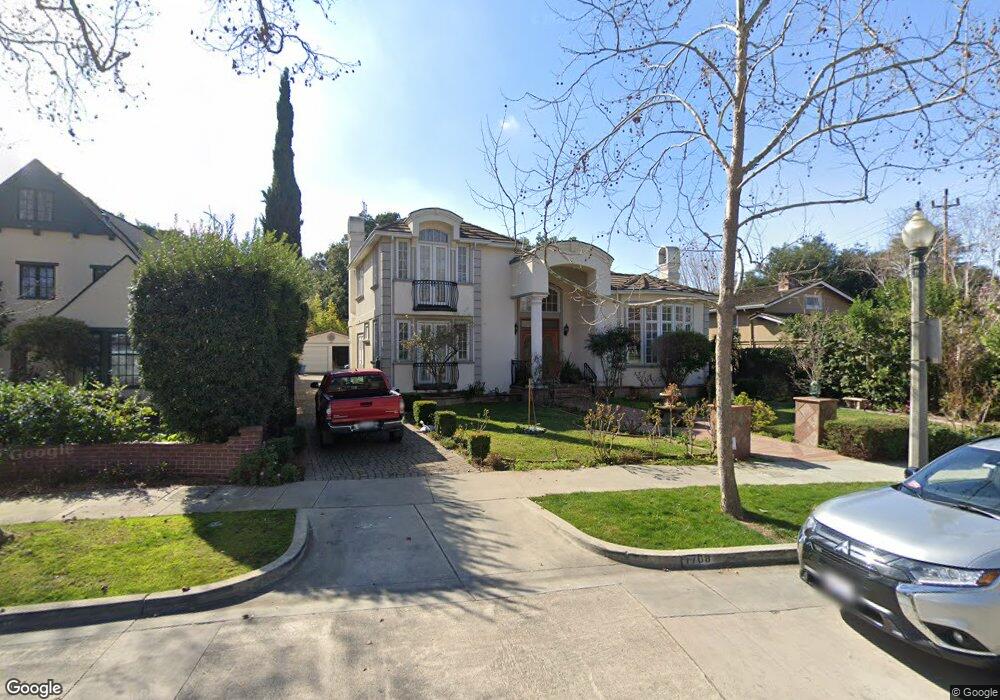
1708 Fulton St Palo Alto, CA 94303
Old Palo Alto NeighborhoodEstimated Value: $5,994,000 - $6,793,000
4
Beds
4
Baths
3,480
Sq Ft
$1,816/Sq Ft
Est. Value
About This Home
This home is located at 1708 Fulton St, Palo Alto, CA 94303 and is currently estimated at $6,319,302, approximately $1,815 per square foot. 1708 Fulton St is a home located in Santa Clara County with nearby schools including Walter Hays Elementary, Frank S. Greene Jr. Middle, and Palo Alto High School.
Ownership History
Date
Name
Owned For
Owner Type
Purchase Details
Closed on
Jan 7, 2021
Sold by
Stanton Midori N
Bought by
Stanton Midori N and Stanton Robert B
Current Estimated Value
Purchase Details
Closed on
Jan 14, 2008
Sold by
Stanton Midori N
Bought by
Stanton Midori N
Purchase Details
Closed on
Dec 7, 2004
Sold by
Nagata Izaya
Bought by
Stanton Midori N
Purchase Details
Closed on
Oct 25, 1997
Sold by
Stanton Midori
Bought by
Nagata Izaya
Home Financials for this Owner
Home Financials are based on the most recent Mortgage that was taken out on this home.
Original Mortgage
$214,600
Interest Rate
7.44%
Purchase Details
Closed on
Sep 30, 1997
Sold by
Shakernia Hassan and Shakernia Maryam
Bought by
Stanton Robert B and Stanton Midori N
Home Financials for this Owner
Home Financials are based on the most recent Mortgage that was taken out on this home.
Original Mortgage
$214,600
Interest Rate
7.44%
Purchase Details
Closed on
Feb 28, 1996
Sold by
Shakernia Hassan and Shakernia Maryam
Bought by
Nasser Kevan
Home Financials for this Owner
Home Financials are based on the most recent Mortgage that was taken out on this home.
Original Mortgage
$480,800
Interest Rate
7.1%
Purchase Details
Closed on
Feb 13, 1996
Sold by
Kuehn Meredith G and Gregg David L
Bought by
Shakernia Hassan and Shakernia Maryam
Home Financials for this Owner
Home Financials are based on the most recent Mortgage that was taken out on this home.
Original Mortgage
$480,800
Interest Rate
7.1%
Purchase Details
Closed on
Nov 15, 1995
Sold by
Gregg Jennifer
Bought by
Gregg David L and Gregg Lee
Home Financials for this Owner
Home Financials are based on the most recent Mortgage that was taken out on this home.
Original Mortgage
$150,000
Interest Rate
6.75%
Purchase Details
Closed on
Nov 14, 1995
Sold by
Gregg David L and Gregg Lee
Bought by
Gregg David L and Gregg Lee
Home Financials for this Owner
Home Financials are based on the most recent Mortgage that was taken out on this home.
Original Mortgage
$150,000
Interest Rate
6.75%
Purchase Details
Closed on
Oct 30, 1995
Sold by
Kuehn George A
Bought by
Kuehn Meredith G
Home Financials for this Owner
Home Financials are based on the most recent Mortgage that was taken out on this home.
Original Mortgage
$150,000
Interest Rate
6.75%
Purchase Details
Closed on
Mar 13, 1995
Sold by
Wells Fargo Bank N A
Bought by
Gregg David L and Gregg Lee
Create a Home Valuation Report for This Property
The Home Valuation Report is an in-depth analysis detailing your home's value as well as a comparison with similar homes in the area
Home Values in the Area
Average Home Value in this Area
Purchase History
| Date | Buyer | Sale Price | Title Company |
|---|---|---|---|
| Stanton Midori N | -- | None Listed On Document | |
| Stanton Robert B | -- | None Listed On Document | |
| Stanton Midori N | -- | None Available | |
| Stanton Midori N | -- | -- | |
| Nagata Izaya | -- | -- | |
| Stanton Robert B | $1,915,000 | Old Republic Title Company | |
| Nasser Kevan | -- | -- | |
| Shakernia Hassan | $601,000 | Old Republic Title Company | |
| Gregg David L | $150,000 | Fidelity National Title Ins | |
| Gregg David L | -- | Fidelity National Title Ins | |
| Gregg David L | -- | Fidelity National Title Ins | |
| Kuehn Meredith G | -- | Fidelity National Title Ins | |
| Gregg David L | -- | -- |
Source: Public Records
Mortgage History
| Date | Status | Borrower | Loan Amount |
|---|---|---|---|
| Previous Owner | Stanton Robert B | $214,600 | |
| Previous Owner | Shakernia Hassan | $480,800 | |
| Previous Owner | Gregg David L | $150,000 |
Source: Public Records
Tax History Compared to Growth
Tax History
| Year | Tax Paid | Tax Assessment Tax Assessment Total Assessment is a certain percentage of the fair market value that is determined by local assessors to be the total taxable value of land and additions on the property. | Land | Improvement |
|---|---|---|---|---|
| 2025 | $37,462 | $3,165,472 | $2,803,141 | $362,331 |
| 2024 | $37,462 | $3,103,405 | $2,748,178 | $355,227 |
| 2023 | $36,913 | $3,042,555 | $2,694,293 | $348,262 |
| 2022 | $36,488 | $2,982,898 | $2,641,464 | $341,434 |
| 2021 | $35,687 | $2,924,411 | $2,589,671 | $334,740 |
| 2020 | $34,946 | $2,894,426 | $2,563,118 | $331,308 |
| 2019 | $34,560 | $2,837,673 | $2,512,861 | $324,812 |
| 2018 | $33,605 | $2,782,034 | $2,463,590 | $318,444 |
| 2017 | $33,015 | $2,727,485 | $2,415,285 | $312,200 |
| 2016 | $32,151 | $2,674,006 | $2,367,927 | $306,079 |
| 2015 | $31,838 | $2,633,841 | $2,332,359 | $301,482 |
| 2014 | $31,219 | $2,582,249 | $2,286,672 | $295,577 |
Source: Public Records
Map
Nearby Homes
- 1711 Guinda St
- 627 Tennyson Ave
- 1730 Webster St
- 1119 Hopkins Ave
- 1827 Cowper St
- 444 Tennyson Ave
- 1218 Middlefield Rd
- 671 Kingsley Ave
- 535 Kingsley Ave
- 20 Kent Place
- 1033 Guinda St
- 61 Primrose Way
- 184 Tennyson Ave
- 560 Addison Ave
- 536 Addison Ave
- 961 Channing Ave
- 125 Lowell Ave
- 1932 Emerson St
- 1027 Waverley St
- 1555 Alma St
- 1700 Fulton St
- 1665 Middlefield Rd
- 1726 Fulton St
- 1675 Middlefield Rd
- 750 Embarcadero Rd
- 1705 Fulton St
- 1655 Middlefield Rd
- 1699 Middlefield Rd
- 1715 Fulton St
- 780 Embarcadero Rd
- 1734 Fulton St
- 1707 Middlefield Rd
- 1625 Middlefield Rd
- 1731 Fulton St
- 1717 Middlefield Rd
- 685 Lowell Ave
- 1700 Guinda St
- 1748 Fulton St
- 1745 Fulton St
- 1710 Guinda St