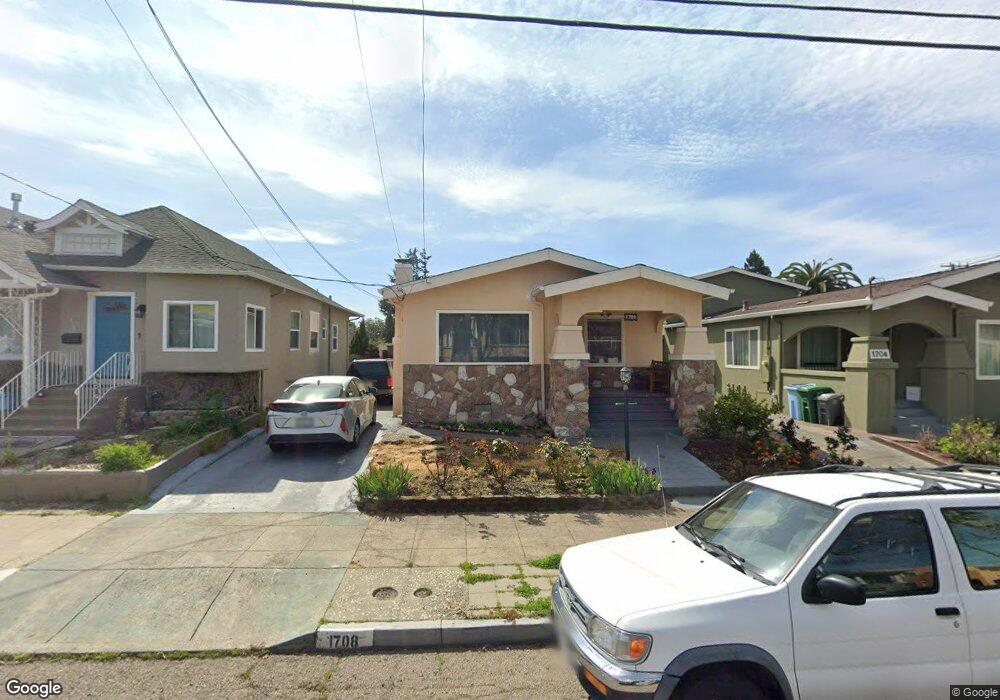
1708 Stuart St Berkeley, CA 94703
South Berkeley NeighborhoodEstimated Value: $1,239,000 - $1,810,673
3
Beds
2
Baths
2,197
Sq Ft
$665/Sq Ft
Est. Value
About This Home
This home is located at 1708 Stuart St, Berkeley, CA 94703 and is currently estimated at $1,460,918, approximately $664 per square foot. 1708 Stuart St is a home located in Alameda County with nearby schools including Malcolm X Elementary School, Emerson Elementary School, and John Muir Elementary School.
Ownership History
Date
Name
Owned For
Owner Type
Purchase Details
Closed on
Apr 19, 2018
Sold by
Sullivan Derrick E and Sullivan Revocable T Derrick E
Bought by
Poon Chung S and Benedict Anna Kathryn
Current Estimated Value
Home Financials for this Owner
Home Financials are based on the most recent Mortgage that was taken out on this home.
Original Mortgage
$700,000
Outstanding Balance
$602,268
Interest Rate
4.46%
Mortgage Type
New Conventional
Estimated Equity
$858,650
Purchase Details
Closed on
Aug 26, 2014
Sold by
Sullivan Derrick E
Bought by
Sullivan Derrick E and Sullivan Revocable L Derrick E
Purchase Details
Closed on
Mar 14, 2006
Sold by
Sullivan Robert and Sullivan Derrick
Bought by
Sullivan Derrick E
Purchase Details
Closed on
Jan 9, 2006
Sold by
Sullivan Robert
Bought by
Sullivan Robert and Sullivan Derrick
Home Financials for this Owner
Home Financials are based on the most recent Mortgage that was taken out on this home.
Original Mortgage
$318,000
Interest Rate
1%
Mortgage Type
New Conventional
Purchase Details
Closed on
Jul 7, 2005
Sold by
Sullivan Robert and Robert & Ada B Sullivan Living
Bought by
Sullivan Robert
Home Financials for this Owner
Home Financials are based on the most recent Mortgage that was taken out on this home.
Original Mortgage
$285,000
Interest Rate
5.55%
Mortgage Type
New Conventional
Purchase Details
Closed on
Nov 11, 1995
Sold by
Sullivan Robert and Sullivan Ada B
Bought by
Sullivan Robert and Sullivan Ada B
Create a Home Valuation Report for This Property
The Home Valuation Report is an in-depth analysis detailing your home's value as well as a comparison with similar homes in the area
Home Values in the Area
Average Home Value in this Area
Purchase History
| Date | Buyer | Sale Price | Title Company |
|---|---|---|---|
| Poon Chung S | $1,135,000 | Chicago Title Company | |
| Sullivan Derrick E | -- | None Available | |
| Sullivan Derrick E | -- | Commonwealth Land Title | |
| Sullivan Robert | -- | Commonwealth Land Title | |
| Sullivan Robert | -- | Commonwealth | |
| Sullivan Robert | -- | First American Title Lenders | |
| Sullivan Robert | -- | -- |
Source: Public Records
Mortgage History
| Date | Status | Borrower | Loan Amount |
|---|---|---|---|
| Open | Poon Chung S | $700,000 | |
| Previous Owner | Sullivan Robert | $318,000 | |
| Previous Owner | Sullivan Robert | $285,000 |
Source: Public Records
Tax History
| Year | Tax Paid | Tax Assessment Tax Assessment Total Assessment is a certain percentage of the fair market value that is determined by local assessors to be the total taxable value of land and additions on the property. | Land | Improvement |
|---|---|---|---|---|
| 2025 | $17,674 | $1,284,414 | $387,424 | $903,990 |
| 2024 | $17,674 | $1,259,091 | $379,827 | $886,264 |
| 2023 | $17,329 | $1,241,270 | $372,381 | $868,889 |
| 2022 | $17,068 | $1,209,934 | $365,080 | $851,854 |
| 2021 | $17,140 | $1,186,077 | $357,923 | $835,154 |
| 2020 | $16,345 | $1,180,853 | $354,256 | $826,597 |
| 2019 | $15,838 | $1,157,700 | $347,310 | $810,390 |
| 2018 | $2,610 | $76,894 | $24,980 | $51,914 |
| 2017 | $3,457 | $75,387 | $24,491 | $50,896 |
| 2016 | $3,248 | $73,908 | $24,010 | $49,898 |
| 2015 | $3,175 | $72,798 | $23,650 | $49,148 |
| 2014 | $3,098 | $71,373 | $23,187 | $48,186 |
Source: Public Records
Map
Nearby Homes
- 2701 Grant St
- 2926 Ellis St
- 1530 Stuart St
- 1612 Carleton St
- 1535 Julia St
- 1646 Ashby Ave
- 1612 Parker St
- 1515 Derby St
- 2790 Sacramento St
- 2782 Sacramento St
- 2750 Sacramento St
- 2774 Sacramento St
- 2758 Sacramento St
- 1450 Ward St
- 1901 Parker St Unit 3
- 2922 Stanton St
- 1645 Dwight Way
- 1507 Prince St
- 3110 California St
- 3114 California St
Your Personal Tour Guide
Ask me questions while you tour the home.