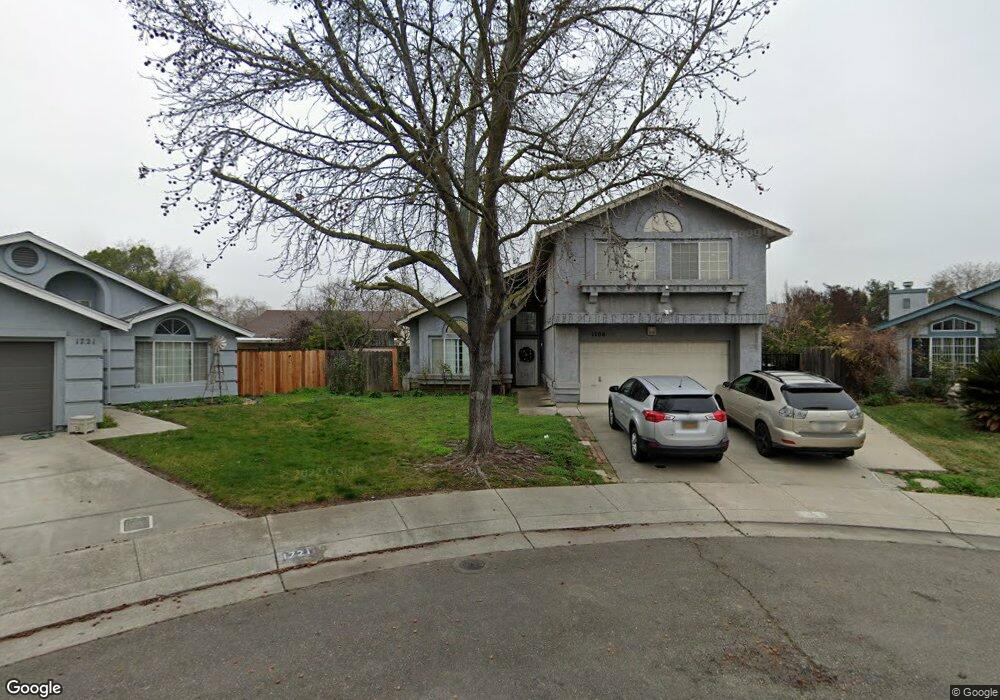
1708 Swenson Ct Stockton, CA 95206
Seaport NeighborhoodEstimated Value: $422,000 - $484,000
4
Beds
3
Baths
1,796
Sq Ft
$253/Sq Ft
Est. Value
About This Home
This home is located at 1708 Swenson Ct, Stockton, CA 95206 and is currently estimated at $454,333, approximately $252 per square foot. 1708 Swenson Ct is a home located in San Joaquin County with nearby schools including San Joaquin Elementary School, Taylor Leadership Academy, and John Marshall Elementary School.
Ownership History
Date
Name
Owned For
Owner Type
Purchase Details
Closed on
Oct 7, 2017
Sold by
Adajar Bianca Marie L
Bought by
Lopez Blessilda G and Adajar Bianca Marie L
Current Estimated Value
Purchase Details
Closed on
Jun 22, 2016
Sold by
Rasalan Marietta L and Rasalan Abraham R
Bought by
Adajar Bianca Marie L
Home Financials for this Owner
Home Financials are based on the most recent Mortgage that was taken out on this home.
Original Mortgage
$220,899
Outstanding Balance
$176,835
Interest Rate
3.75%
Mortgage Type
FHA
Estimated Equity
$277,498
Purchase Details
Closed on
Nov 16, 2006
Sold by
Rasalan Abraham R and Rasalan Marietta L
Bought by
Rasalan Abraham R and Rasalan Marietta L
Home Financials for this Owner
Home Financials are based on the most recent Mortgage that was taken out on this home.
Original Mortgage
$328,000
Interest Rate
6.45%
Mortgage Type
Purchase Money Mortgage
Create a Home Valuation Report for This Property
The Home Valuation Report is an in-depth analysis detailing your home's value as well as a comparison with similar homes in the area
Home Values in the Area
Average Home Value in this Area
Purchase History
| Date | Buyer | Sale Price | Title Company |
|---|---|---|---|
| Lopez Blessilda G | -- | None Available | |
| Adajar Bianca Marie L | $225,000 | Chicago Title Company | |
| Rasalan Abraham R | -- | Fidelity Natl Title Co Of Ca |
Source: Public Records
Mortgage History
| Date | Status | Borrower | Loan Amount |
|---|---|---|---|
| Open | Adajar Bianca Marie L | $220,899 | |
| Previous Owner | Rasalan Abraham R | $328,000 |
Source: Public Records
Tax History Compared to Growth
Tax History
| Year | Tax Paid | Tax Assessment Tax Assessment Total Assessment is a certain percentage of the fair market value that is determined by local assessors to be the total taxable value of land and additions on the property. | Land | Improvement |
|---|---|---|---|---|
| 2025 | $3,438 | $266,344 | $93,514 | $172,830 |
| 2024 | $3,383 | $261,123 | $91,681 | $169,442 |
| 2023 | $3,307 | $256,004 | $89,884 | $166,120 |
| 2022 | $3,166 | $250,985 | $88,122 | $162,863 |
| 2021 | $3,048 | $246,065 | $86,395 | $159,670 |
| 2020 | $3,107 | $243,543 | $85,510 | $158,033 |
| 2019 | $3,095 | $238,769 | $83,834 | $154,935 |
| 2018 | $3,470 | $234,089 | $82,191 | $151,898 |
| 2017 | $3,219 | $229,500 | $80,580 | $148,920 |
| 2016 | $2,868 | $201,751 | $52,267 | $149,484 |
| 2015 | $2,869 | $198,721 | $51,482 | $147,239 |
| 2014 | $2,630 | $187,000 | $56,000 | $131,000 |
Source: Public Records
Map
Nearby Homes
- 2650 S Fresno Ave
- 2128 Green River Ln
- 1409 Laguna Cir
- 1823 Fort Hall Place
- 1156 Derrick Dr
- 2050 Grey Stone Dr
- 2242 Port Trinity Cir
- 864 W 5th St
- 1638 S Argonaut St
- 663 Chicago Ave
- 2079 Gordon Verner Cir
- 2215 Dune Place
- 3330 Konig Ct
- 1890 Gordon Verner Cir
- 3504 French Camp Turnpike
- 1526 Kimiyo St
- 3745 Wild Rose Ln
- 509 Howard St
- 2402 Sailboat Ct
- 3412 Shogoro Ln
- 1720 Swenson Ct
- 1721 Swenson Ct
- 2367 Silverado Ct
- 2355 Silverado Ct
- 1743 Swenson Ct
- 1742 Swenson Ct
- 2339 Silverado Ct
- 2413 Silverado Ct
- 2402 Discovery Ct
- 1765 Swenson Ct
- 1764 Swenson Ct
- 1744 Diablo Creek Dr
- 1720 Diablo Creek Dr
- 2419 Discovery Ct
- 1762 Diablo Creek Dr
- 2416 Discovery Ct
- 1704 Diablo Creek Dr
- 1786 Swenson Ct
- 1770 Diablo Creek Dr
- 2419 Silverado Ct