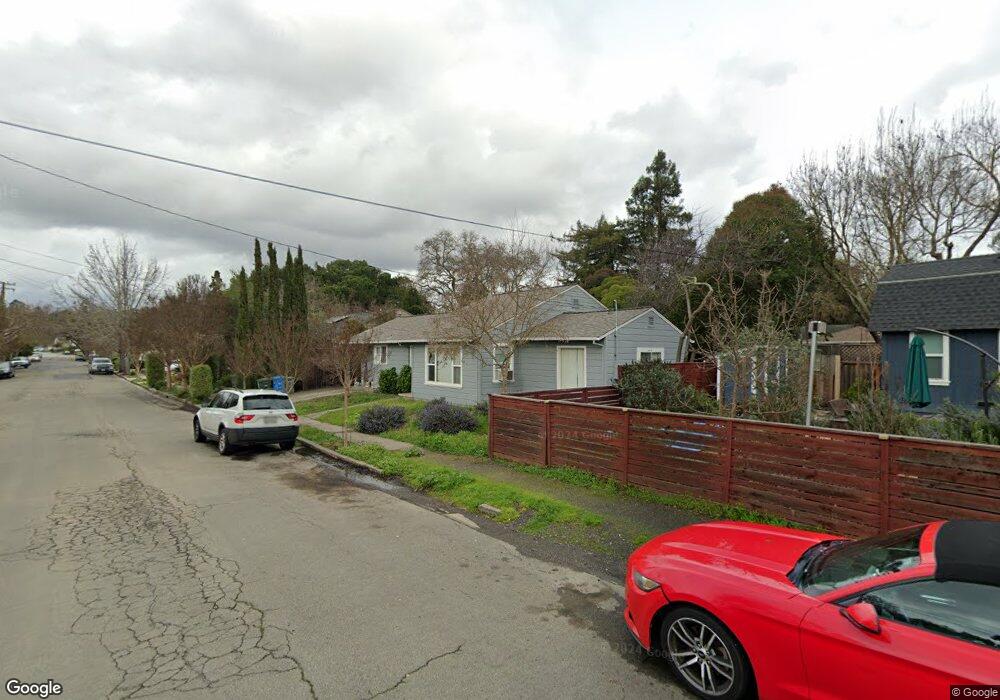
1708 Wright St Santa Rosa, CA 95404
Junior College NeighborhoodEstimated Value: $700,852 - $814,000
3
Beds
1
Bath
1,369
Sq Ft
$552/Sq Ft
Est. Value
About This Home
This home is located at 1708 Wright St, Santa Rosa, CA 95404 and is currently estimated at $755,963, approximately $552 per square foot. 1708 Wright St is a home located in Sonoma County with nearby schools including Steele Lane Elementary School, Santa Rosa Middle School, and Santa Rosa High School.
Ownership History
Date
Name
Owned For
Owner Type
Purchase Details
Closed on
Jan 15, 2020
Sold by
Crandall James F and Crandall Patricia N
Bought by
Crandall James Forrest and Crandall Patricia Newman
Current Estimated Value
Purchase Details
Closed on
Feb 16, 2012
Sold by
Crandall James F and Crandall Patricia N
Bought by
Crandall James F and Crandall Patricia N
Purchase Details
Closed on
Feb 22, 2000
Sold by
Doyel Sue Ann
Bought by
Crandall James F and Crandall Patricia N
Home Financials for this Owner
Home Financials are based on the most recent Mortgage that was taken out on this home.
Original Mortgage
$148,000
Outstanding Balance
$48,925
Interest Rate
8.16%
Estimated Equity
$707,038
Purchase Details
Closed on
Oct 6, 1998
Sold by
Doyel Sue Ann
Bought by
Doyel Sue Ann
Home Financials for this Owner
Home Financials are based on the most recent Mortgage that was taken out on this home.
Original Mortgage
$75,000
Interest Rate
9.5%
Create a Home Valuation Report for This Property
The Home Valuation Report is an in-depth analysis detailing your home's value as well as a comparison with similar homes in the area
Home Values in the Area
Average Home Value in this Area
Purchase History
| Date | Buyer | Sale Price | Title Company |
|---|---|---|---|
| Crandall James Forrest | -- | None Available | |
| Crandall James F | -- | Accommodation | |
| Crandall James F | $185,000 | North American Title Co | |
| Doyel Sue Ann | -- | North American Title Co |
Source: Public Records
Mortgage History
| Date | Status | Borrower | Loan Amount |
|---|---|---|---|
| Open | Crandall James F | $148,000 | |
| Previous Owner | Doyel Sue Ann | $75,000 |
Source: Public Records
Tax History
| Year | Tax Paid | Tax Assessment Tax Assessment Total Assessment is a certain percentage of the fair market value that is determined by local assessors to be the total taxable value of land and additions on the property. | Land | Improvement |
|---|---|---|---|---|
| 2025 | $3,250 | $284,323 | $169,060 | $115,263 |
| 2024 | $3,250 | $278,749 | $165,746 | $113,003 |
| 2023 | $3,250 | $273,285 | $162,497 | $110,788 |
| 2022 | $3,002 | $267,927 | $159,311 | $108,616 |
| 2021 | $2,966 | $262,675 | $156,188 | $106,487 |
| 2020 | $4,236 | $259,983 | $154,587 | $105,396 |
| 2019 | $2,943 | $254,886 | $151,556 | $103,330 |
| 2018 | $2,926 | $249,889 | $148,585 | $101,304 |
| 2017 | $2,874 | $244,990 | $145,672 | $99,318 |
| 2016 | $2,848 | $240,187 | $142,816 | $97,371 |
| 2015 | $2,762 | $236,580 | $140,671 | $95,909 |
| 2014 | $2,595 | $231,947 | $137,916 | $94,031 |
Source: Public Records
Map
Nearby Homes
- 1136 Poppy Dr
- 1829 Wright St
- 1804 Beaver St
- 1055 Wright St
- 1320 North St Unit 7
- 1404 Slater St
- 2149 Humboldt St
- 1102 North St
- 2126 Northwood Dr
- 1016 Spring St
- 1644 Julianne Place
- 689 Plum Dr
- 722 Beaver St
- 1944 Grosse Ave
- 2029 Albany Dr
- 705 College Ave
- 2625 Hidden Valley Dr
- 3460 Happy Valley Ave
- 900 Cherry St
- 2034 Augustan Ave
- 1712 Wright St
- 1109 Carr Ave
- 1159 Carr Ave
- 1722 Wright St
- 1703 Wright St
- 1709 Wright St
- 1711 North St
- 1726 Wright St
- 1120 Carr Ave
- 1715 NE Wright Street None
- 1185 Carr Ave
- 1110 Carr Ave
- 1717 North St
- 1727 Wright St
- 1160 Carr Ave
- 1017 Carr Ave
- 1738 Wright St
- 1125 Fulkerson St
- 1115 Fulkerson St
- 1725 North St
Your Personal Tour Guide
Ask me questions while you tour the home.