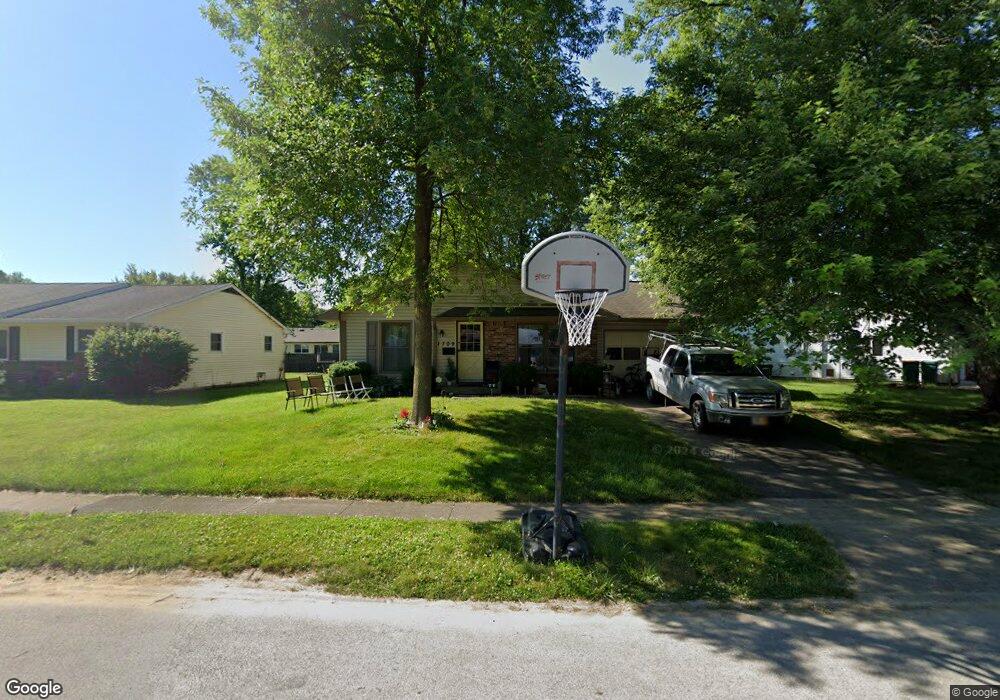
1709 Hemlock Ln Plainfield, IN 46168
Estimated Value: $222,479 - $240,000
4
Beds
2
Baths
1,073
Sq Ft
$215/Sq Ft
Est. Value
About This Home
This home is located at 1709 Hemlock Ln, Plainfield, IN 46168 and is currently estimated at $230,620, approximately $214 per square foot. 1709 Hemlock Ln is a home located in Hendricks County with nearby schools including Van Buren Elementary School, Plainfield Community Middle School, and Plainfield High School.
Ownership History
Date
Name
Owned For
Owner Type
Purchase Details
Closed on
May 19, 2021
Sold by
Faulkenberg Frank W
Bought by
Faulkenberg Frank W and Faulkenberg Alice M
Current Estimated Value
Purchase Details
Closed on
Nov 1, 2012
Sold by
Faulkenberg William A and Faulkenberg Sharon R
Bought by
Faulkenberg Frank
Home Financials for this Owner
Home Financials are based on the most recent Mortgage that was taken out on this home.
Original Mortgage
$84,000
Outstanding Balance
$11,646
Interest Rate
2.71%
Mortgage Type
New Conventional
Estimated Equity
$218,974
Purchase Details
Closed on
May 27, 2010
Sold by
Pinkley Thomas J and Pinkley Patricia L
Bought by
Faulkenberg Frank and Faulkenberg William A
Home Financials for this Owner
Home Financials are based on the most recent Mortgage that was taken out on this home.
Original Mortgage
$83,870
Interest Rate
5.13%
Mortgage Type
FHA
Create a Home Valuation Report for This Property
The Home Valuation Report is an in-depth analysis detailing your home's value as well as a comparison with similar homes in the area
Home Values in the Area
Average Home Value in this Area
Purchase History
| Date | Buyer | Sale Price | Title Company |
|---|---|---|---|
| Faulkenberg Frank W | -- | None Available | |
| Faulkenberg Frank | -- | None Available | |
| Faulkenberg Frank | -- | None Available |
Source: Public Records
Mortgage History
| Date | Status | Borrower | Loan Amount |
|---|---|---|---|
| Open | Faulkenberg Frank | $84,000 | |
| Closed | Faulkenberg Frank | $83,870 |
Source: Public Records
Tax History
| Year | Tax Paid | Tax Assessment Tax Assessment Total Assessment is a certain percentage of the fair market value that is determined by local assessors to be the total taxable value of land and additions on the property. | Land | Improvement |
|---|---|---|---|---|
| 2025 | $1,155 | $169,900 | $40,000 | $129,900 |
| 2024 | $1,155 | $150,200 | $31,200 | $119,000 |
| 2023 | $971 | $134,400 | $28,000 | $106,400 |
| 2022 | $975 | $128,200 | $26,600 | $101,600 |
| 2021 | $836 | $115,500 | $25,500 | $90,000 |
| 2020 | $965 | $126,100 | $24,000 | $102,100 |
| 2019 | $855 | $118,300 | $22,700 | $95,600 |
| 2018 | $862 | $116,800 | $22,700 | $94,100 |
| 2017 | $712 | $102,600 | $22,700 | $79,900 |
| 2016 | $733 | $104,300 | $22,700 | $81,600 |
| 2014 | $584 | $91,900 | $20,200 | $71,700 |
Source: Public Records
Map
Nearby Homes
- 408 Linden Ln
- 504 Magnolia Dr
- 1710 Beechwood Dr
- 1429 Blackthorne Trail N
- 446 Breakwater Dr
- 522 Breakwater Dr
- 2234 Galleone Way
- 2644 Prism Way
- 2654 Prism Way
- 2674 Prism Way
- 2686 Prism Way
- 9086 Anthem Ave
- 473 Seagrape Ln
- 537 Seagrape Ln
- 2879 Bluewood Way
- 2206 Galleone Way
- 2212 Galleone Way
- 2808 Twinleaf Dr
- 2226 Galleone Way
- 497 Regatta Ln
- 516 Linden Ln
- 1713 Hemlock Ln
- 512 Linden Ln
- 1717 Hemlock Ln
- 431 Hickory Ln
- 435 Hickory Ln
- 1710 Hemlock Ln
- 1714 Hemlock Ln
- 508 Linden Ln
- 1704 Hemlock Ln
- 1718 Hemlock Ln
- 1721 Hemlock Ln
- 427 Hickory Ln
- 439 Hickory Ln
- 517 Linden Ln
- 1722 Hemlock Ln
- 509 Linden Ln
- 504 Linden Ln
- 1725 Hemlock Ln
- 505 Linden Ln Unit 507
Your Personal Tour Guide
Ask me questions while you tour the home.