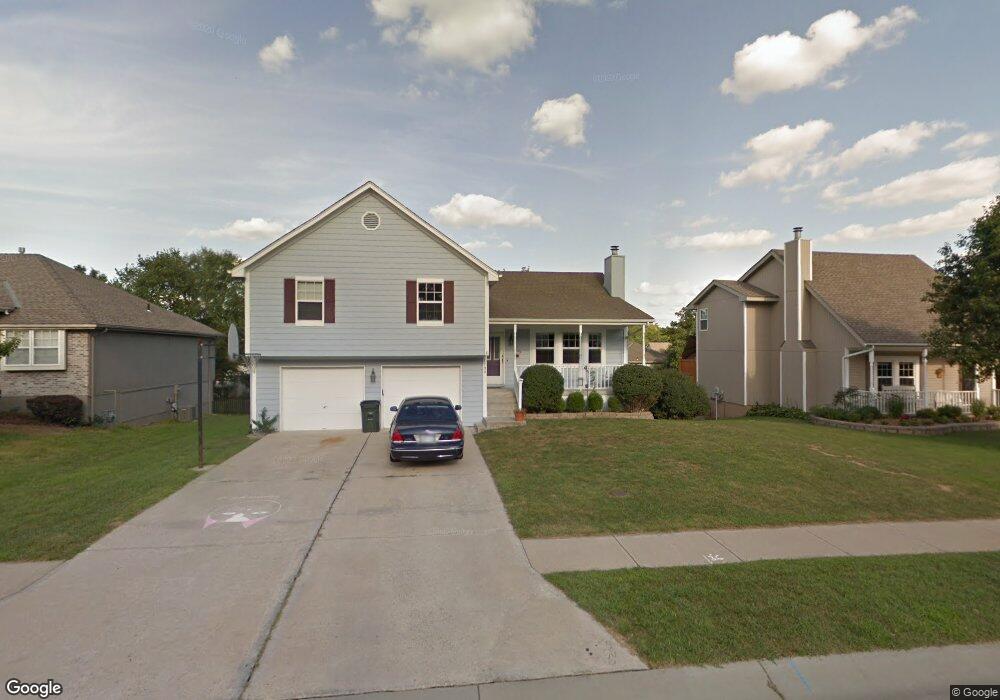
1709 NE Whitestone Dr Lees Summit, MO 64086
Estimated Value: $331,486 - $379,000
3
Beds
2
Baths
1,740
Sq Ft
$204/Sq Ft
Est. Value
About This Home
This home is located at 1709 NE Whitestone Dr, Lees Summit, MO 64086 and is currently estimated at $355,122, approximately $204 per square foot. 1709 NE Whitestone Dr is a home located in Jackson County with nearby schools including Underwood Elementary School, Bernard C. Campbell Middle School, and Lee's Summit North High School.
Ownership History
Date
Name
Owned For
Owner Type
Purchase Details
Closed on
Apr 17, 2018
Sold by
Pendleton George A
Bought by
Pendleton Deanna A
Current Estimated Value
Purchase Details
Closed on
Jun 21, 2011
Sold by
Secretary Of Housing & Urban Development
Bought by
Pendleton George A and Pendleton Deanna A
Purchase Details
Closed on
Jan 3, 2011
Sold by
The Bank Of New York Mellon Na
Bought by
Secretary Of Housing & Urban Development
Purchase Details
Closed on
Aug 20, 2010
Sold by
Warner Jenny K and Warner Jonathan
Bought by
The Bank Of New York Mellon Na and The Bank Of New York Trust Company Na
Purchase Details
Closed on
Jul 13, 2004
Sold by
Hayes Philip R and Hayes Kathleen F
Bought by
Warner Jonathan D and Warner Jenny K
Home Financials for this Owner
Home Financials are based on the most recent Mortgage that was taken out on this home.
Original Mortgage
$155,759
Interest Rate
6.32%
Mortgage Type
FHA
Create a Home Valuation Report for This Property
The Home Valuation Report is an in-depth analysis detailing your home's value as well as a comparison with similar homes in the area
Home Values in the Area
Average Home Value in this Area
Purchase History
| Date | Buyer | Sale Price | Title Company |
|---|---|---|---|
| Pendleton Deanna A | -- | None Available | |
| Pendleton George A | -- | None Available | |
| Secretary Of Housing & Urban Development | -- | None Available | |
| The Bank Of New York Mellon Na | $166,382 | None Available | |
| Warner Jonathan D | -- | Kansas City Title |
Source: Public Records
Mortgage History
| Date | Status | Borrower | Loan Amount |
|---|---|---|---|
| Previous Owner | Warner Jonathan D | $155,759 |
Source: Public Records
Tax History
| Year | Tax Paid | Tax Assessment Tax Assessment Total Assessment is a certain percentage of the fair market value that is determined by local assessors to be the total taxable value of land and additions on the property. | Land | Improvement |
|---|---|---|---|---|
| 2025 | $3,321 | $50,506 | $7,370 | $43,136 |
| 2024 | $3,297 | $45,997 | $5,689 | $40,308 |
| 2023 | $3,297 | $45,997 | $5,732 | $40,265 |
| 2022 | $3,083 | $38,190 | $5,719 | $32,471 |
| 2021 | $3,147 | $38,190 | $5,719 | $32,471 |
| 2020 | $2,886 | $34,690 | $5,719 | $28,971 |
| 2019 | $2,808 | $34,690 | $5,719 | $28,971 |
| 2018 | $2,884 | $33,071 | $4,836 | $28,235 |
| 2016 | $2,841 | $32,243 | $4,617 | $27,626 |
Source: Public Records
Map
Nearby Homes
- 1717 NE Luther Rd
- 1541 NE Neawanna Dr
- 1133 NE Mulberry St
- 1141 NE Hunters Ridge
- 1118 NE Deerbrook Terrace
- 1213 NE Ball Dr
- 1104 NE Country Ln
- 1676 NE Ozark Dr
- 1616 NE Bluff St
- 816 NE Pollard St
- 809 NE Cedar St
- 812 NE Mulberry St
- 1708 NE Balboa St
- 1700 NE Bluff St
- 1708 NE Bluff St
- 1704 NE Bluff St
- 1029 NE Brookfield Dr
- 1028 NE Brookfield Dr
- 13511 Woodland Ranch Dr
- 13311 Woodland Ranch Dr
- 1705 NE Whitestone Dr
- 1713 NE Whitestone Dr
- 1708 NE Whitestone Dr
- 1712 NE Whitestone Dr
- 1704 NE Whitestone Dr
- 1701 NE Whitestone Dr
- 1717 NE Whitestone Dr
- 1716 NE Whitestone Dr
- 1712 NE Stonewood Dr
- 1704 NE Stonewood Dr
- 1500 NE Bronze Dr
- 1721 NE Whitestone Dr
- 1716 NE Stonewood Dr
- 1700 NE Stonewood Dr
- 1720 NE Whitestone Dr
- 1720 NE Stonewood Dr
- 1424 NE Burgandy Ln
- 1420 NE Burgandy Ln
- 1709 NE Stonewood Dr
- 1633 NE Whitestone Dr
Your Personal Tour Guide
Ask me questions while you tour the home.