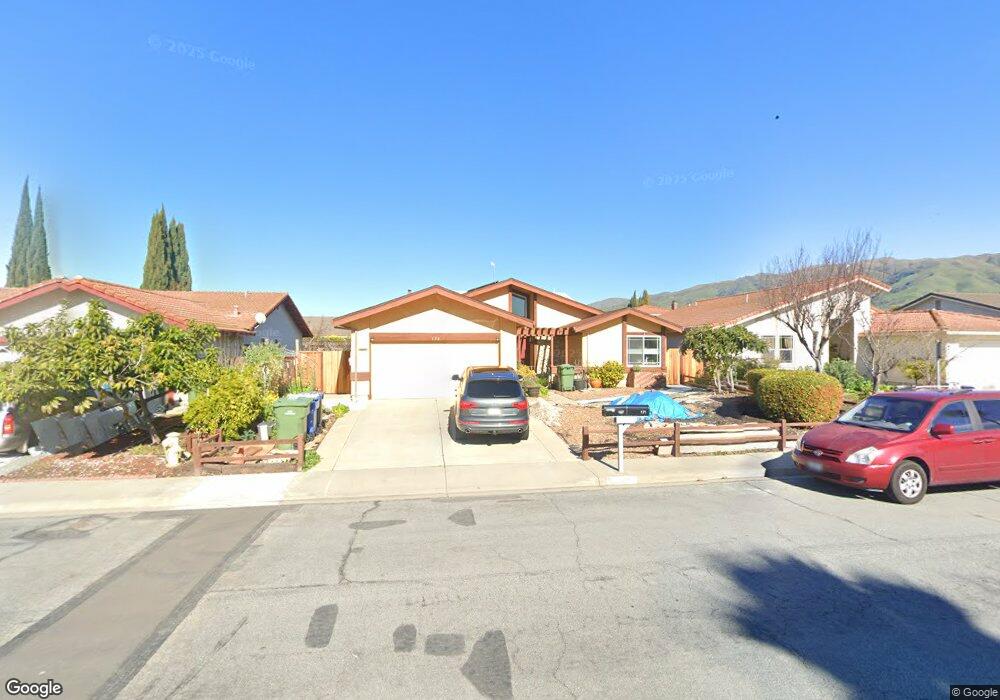
171 Midwick Dr Milpitas, CA 95035
Estimated Value: $1,687,134 - $1,789,000
3
Beds
2
Baths
--
Sq Ft
--
Built
About This Home
This home is located at 171 Midwick Dr, Milpitas, CA 95035 and is currently estimated at $1,735,534. 171 Midwick Dr is a home located in Santa Clara County with nearby schools including Marshall Pomeroy Elementary School, Thomas Russell Middle School, and Milpitas High School.
Ownership History
Date
Name
Owned For
Owner Type
Purchase Details
Closed on
Nov 21, 2016
Sold by
Chew Soon Ing and Lai Jacqueline
Bought by
Chew Soon Ing and Lai Yuen Kuan Jacqueline
Current Estimated Value
Purchase Details
Closed on
Apr 14, 2005
Sold by
Mandadi Venkata and Arikatla Anitha
Bought by
Chew Soon Ing and Lai Jacqueline
Home Financials for this Owner
Home Financials are based on the most recent Mortgage that was taken out on this home.
Original Mortgage
$592,000
Outstanding Balance
$294,922
Interest Rate
5.25%
Mortgage Type
Purchase Money Mortgage
Estimated Equity
$1,440,612
Purchase Details
Closed on
Aug 2, 1999
Sold by
Nielson Carl D and Nielson Penny L
Bought by
Mandadi Venkata and Arikatla Anitha
Home Financials for this Owner
Home Financials are based on the most recent Mortgage that was taken out on this home.
Original Mortgage
$346,450
Interest Rate
7.25%
Create a Home Valuation Report for This Property
The Home Valuation Report is an in-depth analysis detailing your home's value as well as a comparison with similar homes in the area
Home Values in the Area
Average Home Value in this Area
Purchase History
| Date | Buyer | Sale Price | Title Company |
|---|---|---|---|
| Chew Soon Ing | -- | None Available | |
| Chew Soon Ing | $740,000 | New Century Title Company | |
| Mandadi Venkata | $385,000 | Alliance Title Company |
Source: Public Records
Mortgage History
| Date | Status | Borrower | Loan Amount |
|---|---|---|---|
| Open | Chew Soon Ing | $592,000 | |
| Previous Owner | Mandadi Venkata | $346,450 |
Source: Public Records
Tax History
| Year | Tax Paid | Tax Assessment Tax Assessment Total Assessment is a certain percentage of the fair market value that is determined by local assessors to be the total taxable value of land and additions on the property. | Land | Improvement |
|---|---|---|---|---|
| 2025 | $13,910 | $1,224,648 | $463,887 | $760,761 |
| 2024 | $13,910 | $1,200,637 | $454,792 | $745,845 |
| 2023 | $13,866 | $1,177,096 | $445,875 | $731,221 |
| 2022 | $12,336 | $1,029,324 | $437,133 | $592,191 |
| 2021 | $11,485 | $952,612 | $428,562 | $524,050 |
| 2020 | $11,284 | $942,845 | $424,168 | $518,677 |
| 2019 | $11,154 | $924,358 | $415,851 | $508,507 |
| 2018 | $10,589 | $906,235 | $407,698 | $498,537 |
| 2017 | $10,451 | $888,466 | $399,704 | $488,762 |
| 2016 | $10,029 | $871,046 | $391,867 | $479,179 |
| 2015 | $9,586 | $828,000 | $372,500 | $455,500 |
| 2014 | $8,757 | $761,000 | $342,400 | $418,600 |
Source: Public Records
Map
Nearby Homes
- 60 Jacklin Place
- 390 Valmy St
- 210 Sunnyhills Ct Unit 10
- 1000 Jacklin Rd
- 1637 Roger St
- 685 Parvin Dr
- 1200 N Abbott Ave Unit 200
- 120 Dixon Landing Rd Unit 147
- 1279 Milkweed St
- 1308 N Hillview Dr
- 207 Redwood Ave
- 1006 N Abbott Ave
- 1008 N Abbott Ave
- 1357 California Cir
- 1363 Lilac Way
- 622 Chamise Way
- 1357 Lilac Way
- 1359 Lilac Way
- 1087 N Abbott Ave
- 513 Glenmoor Cir
- 159 Midwick Dr
- 183 Midwick Dr
- 174 Beaumere Way
- 162 Beaumere Way
- 147 Midwick Dr
- 195 Midwick Dr
- 186 Beaumere Way
- 150 Beaumere Way
- 198 Beaumere Way
- 166 Midwick Dr
- 178 Midwick Dr
- 207 Midwick Dr
- 135 Midwick Dr
- 154 Midwick Dr
- 190 Midwick Dr
- 138 Beaumere Way
- 210 Beaumere Way
- 142 Midwick Dr
- 202 Midwick Dr
- 123 Midwick Dr
Your Personal Tour Guide
Ask me questions while you tour the home.