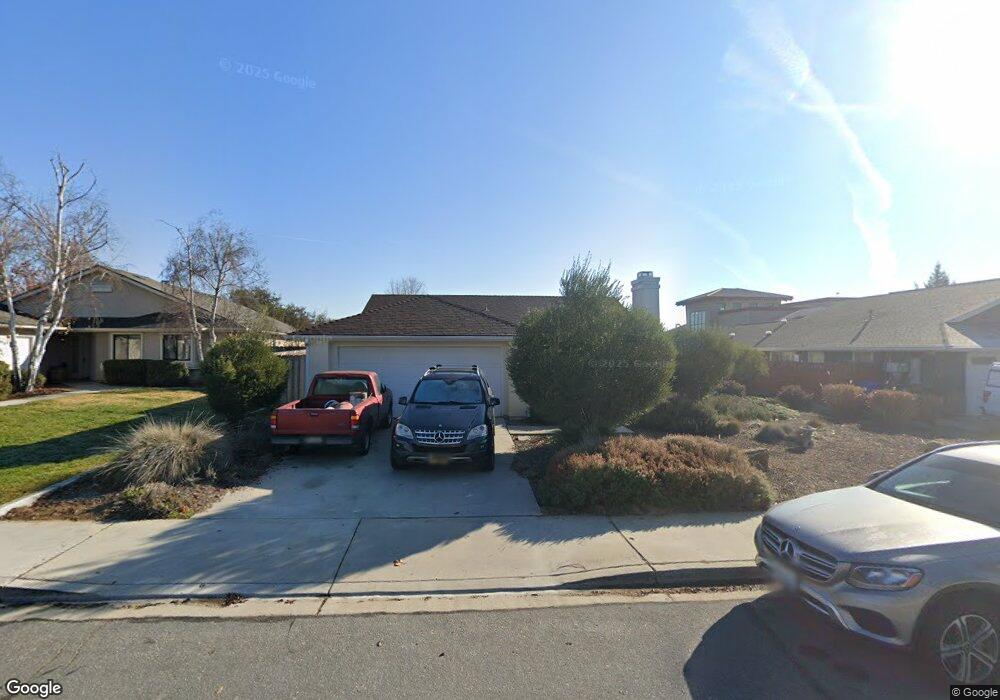
171 Mockingbird Ln Templeton, CA 93465
Estimated Value: $731,339 - $806,000
4
Beds
2
Baths
1,612
Sq Ft
$483/Sq Ft
Est. Value
About This Home
This home is located at 171 Mockingbird Ln, Templeton, CA 93465 and is currently estimated at $778,085, approximately $482 per square foot. 171 Mockingbird Ln is a home located in San Luis Obispo County with nearby schools including Templeton Elementary School, Vineyard Elementary School, and Templeton Middle School.
Ownership History
Date
Name
Owned For
Owner Type
Purchase Details
Closed on
Nov 17, 2017
Sold by
Triplett Wieland James and Triplett Janis Ann
Bought by
Vista Del Lago Investments-1 Llc
Current Estimated Value
Purchase Details
Closed on
Aug 27, 2010
Sold by
Triplett Wieland J and Triplett Janis A
Bought by
Triplett Wieland James and Triplett Janis Ann
Purchase Details
Closed on
Apr 20, 2010
Sold by
Shaner Paul S and Triplett Janis A
Bought by
Triplett Janis A and Triplett Wieland J
Purchase Details
Closed on
Sep 18, 2003
Sold by
Shaner Gerald L and Vera Shaner Bypass Trust
Bought by
Shaner Gerald L and Gerald L Shaner Survivors Trus
Purchase Details
Closed on
Sep 5, 2002
Sold by
Shaner Gerald L and Gerald L & Vera Shaner Living
Bought by
Shaner Gerald L and Vera Shaner Bypass Trust
Purchase Details
Closed on
Sep 1, 1999
Sold by
Shaner Gerald L and Shaner Vera
Bought by
Shaner Gerald L and Shaner Vera
Create a Home Valuation Report for This Property
The Home Valuation Report is an in-depth analysis detailing your home's value as well as a comparison with similar homes in the area
Home Values in the Area
Average Home Value in this Area
Purchase History
| Date | Buyer | Sale Price | Title Company |
|---|---|---|---|
| Vista Del Lago Investments-1 Llc | -- | None Available | |
| Triplett Wieland James | -- | None Available | |
| Triplett Wieland James | -- | None Available | |
| Triplett Janis A | -- | None Available | |
| Shaner Gerald L | -- | -- | |
| Shaner Gerald L | -- | -- | |
| Shaner Gerald L | -- | -- | |
| Shaner Gerald L | -- | -- |
Source: Public Records
Tax History Compared to Growth
Tax History
| Year | Tax Paid | Tax Assessment Tax Assessment Total Assessment is a certain percentage of the fair market value that is determined by local assessors to be the total taxable value of land and additions on the property. | Land | Improvement |
|---|---|---|---|---|
| 2025 | $2,576 | $224,859 | $72,714 | $152,145 |
| 2024 | $2,529 | $220,451 | $71,289 | $149,162 |
| 2023 | $2,529 | $216,130 | $69,892 | $146,238 |
| 2022 | $2,480 | $211,893 | $68,522 | $143,371 |
| 2021 | $2,432 | $207,739 | $67,179 | $140,560 |
| 2020 | $2,405 | $205,610 | $66,491 | $139,119 |
| 2019 | $2,180 | $201,580 | $65,188 | $136,392 |
| 2018 | $2,137 | $197,628 | $63,910 | $133,718 |
| 2017 | $2,095 | $193,754 | $62,657 | $131,097 |
| 2016 | $2,054 | $189,956 | $61,429 | $128,527 |
| 2015 | $2,023 | $187,104 | $60,507 | $126,597 |
| 2014 | $1,948 | $183,440 | $59,322 | $124,118 |
Source: Public Records
Map
Nearby Homes
- 1609 Tanager Ct
- 553 Well Rd
- 1730 Sandalwood Ln
- 117 Frontier Way
- 367 Lily Pad Ln
- 0 Bennett Way
- 730 Rosebay Way
- 750 Gough Ave
- 720 Gough Ave
- 1549 Via Rojas
- 720 Wild Oats Way
- 1220 Bennett Way
- 1220 Bennett Way Unit 97
- 1220 Bennett Way Unit 83
- 8 Championship Ln
- 115 Booker Rd
- 59 8th St
- 30 Corrietta Ct
- 0 Old Creek Rd
- 30 S Main St
- 185 Mockingbird Ln
- 157 Mockingbird Ln
- 187 Mockingbird Ln
- 143 Mockingbird Ln
- 1410 Condor Ln
- 1415 Whippoorwill Ln
- 199 Mockingbird Ln
- 129 Mockingbird Ln
- 1424 Condor Ln
- 1415 Condor Ln
- 1433 Whippoorwill Ln
- 8 Shiloh Place
- 2 Shiloh Place
- 15 Mockingbird Ln
- 1429 Condor Ln
- 1438 Condor Ln
- 1412 Whippoorwill Ln
- 1449 Whippoorwill Ln
- 1432 Whippoorwill Ln
- 1443 Condor Ln