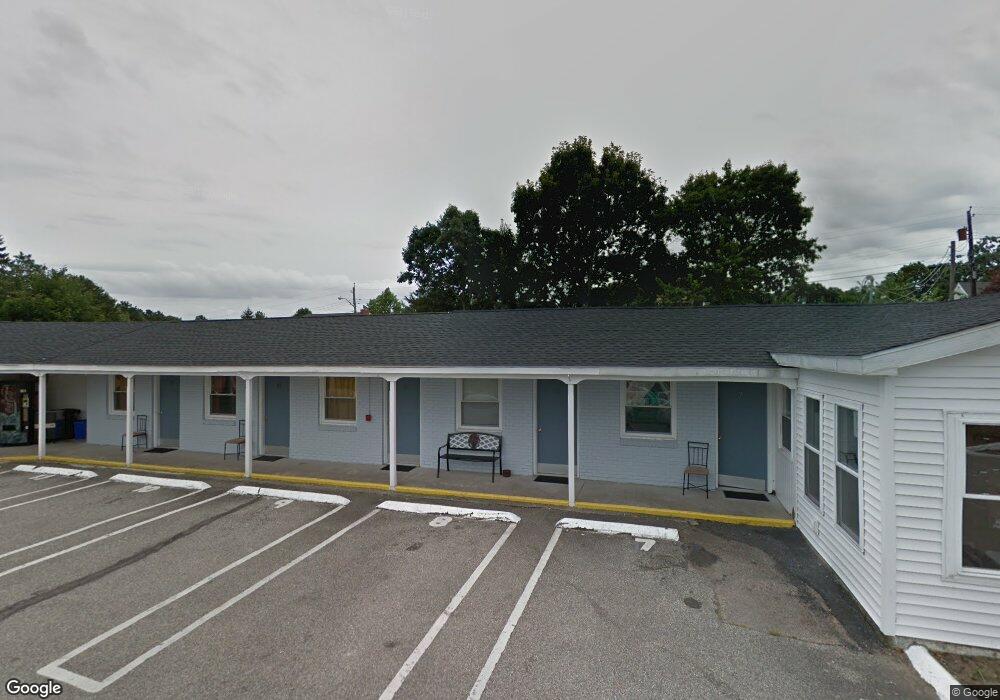
171 Post Rd Westerly, RI 02891
Estimated Value: $1,899,791
Studio
--
Bath
7,293
Sq Ft
$260/Sq Ft
Est. Value
About This Home
This home is located at 171 Post Rd, Westerly, RI 02891 and is currently estimated at $1,899,791, approximately $260 per square foot. 171 Post Rd is a home located in Washington County with nearby schools including Westerly High School and St. Michael School.
Ownership History
Date
Name
Owned For
Owner Type
Purchase Details
Closed on
Apr 13, 2017
Sold by
Sun Hospitality Group
Bought by
Zsand Llc
Current Estimated Value
Purchase Details
Closed on
Jun 19, 2002
Sold by
West Russell and West Linda L
Bought by
Sun Hosp Grp Inc
Home Financials for this Owner
Home Financials are based on the most recent Mortgage that was taken out on this home.
Original Mortgage
$351,000
Interest Rate
6.73%
Mortgage Type
Commercial
Purchase Details
Closed on
Aug 26, 1988
Sold by
Hillside Assoc
Bought by
Vanhouton Paul
Purchase Details
Closed on
Aug 23, 1988
Sold by
Hillside Assoc
Bought by
Harlow Chris
Create a Home Valuation Report for This Property
The Home Valuation Report is an in-depth analysis detailing your home's value as well as a comparison with similar homes in the area
Home Values in the Area
Average Home Value in this Area
Purchase History
| Date | Buyer | Sale Price | Title Company |
|---|---|---|---|
| Zsand Llc | $940,000 | -- | |
| Zsand Llc | $940,000 | -- | |
| Sun Hosp Grp Inc | $615,000 | -- | |
| Vanhouton Paul | $270,000 | -- | |
| Harlow Chris | $180,000 | -- |
Source: Public Records
Mortgage History
| Date | Status | Borrower | Loan Amount |
|---|---|---|---|
| Previous Owner | Harlow Chris | $650,000 | |
| Previous Owner | Harlow Chris | $351,000 | |
| Previous Owner | Harlow Chris | $484,000 |
Source: Public Records
Tax History
| Year | Tax Paid | Tax Assessment Tax Assessment Total Assessment is a certain percentage of the fair market value that is determined by local assessors to be the total taxable value of land and additions on the property. | Land | Improvement |
|---|---|---|---|---|
| 2025 | $5,303 | $745,900 | $298,500 | $447,400 |
| 2024 | $6,231 | $635,200 | $215,900 | $419,300 |
| 2023 | $6,111 | $635,200 | $215,900 | $419,300 |
| 2022 | $5,410 | $565,900 | $215,900 | $350,000 |
| 2021 | $6,478 | $562,300 | $188,600 | $373,700 |
| 2020 | $6,360 | $562,300 | $188,600 | $373,700 |
| 2019 | $6,298 | $562,300 | $188,600 | $373,700 |
| 2018 | $6,337 | $533,400 | $188,600 | $344,800 |
| 2017 | $4,835 | $417,200 | $188,600 | $228,600 |
| 2016 | $4,873 | $417,200 | $188,600 | $228,600 |
| 2015 | $4,483 | $414,300 | $192,600 | $221,700 |
| 2014 | $4,408 | $414,300 | $192,600 | $221,700 |
Source: Public Records
Map
Nearby Homes
- 13 Plateau Rd
- 37 Urso Dr
- 44 Rock Ridge Rd
- 54 Sherwood Dr
- 263 Post Rd
- 30 Clifford Dr
- 46 Salt Pond Way
- 11 Bucks Trail
- 20 Snowberry Ln
- 6 Wilder Ave
- 32 Breach Dr
- 22 Breach Dr
- 15 Breach Dr
- 5 Robin Hollow Ln
- 597 Atlantic Ave
- 118 Dunns Corner Rd
- 446 Atlantic Ave
- 408 Atlantic Ave
- 8 Kettle Close
- 399 Atlantic Ave
Your Personal Tour Guide
Ask me questions while you tour the home.