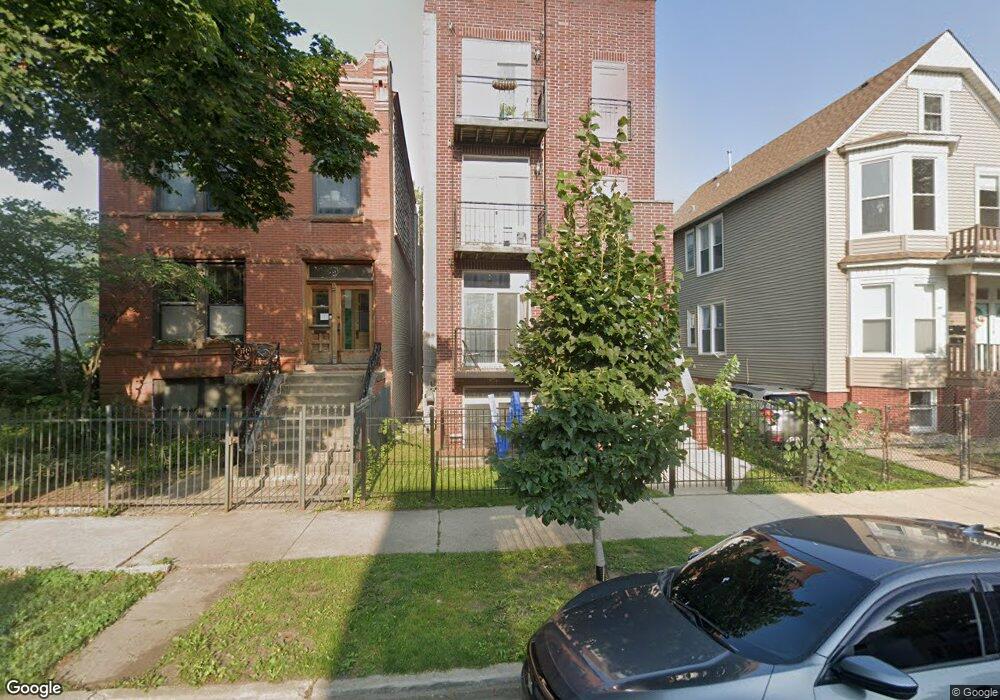
1710 N Whipple St Unit 3 Chicago, IL 60647
Humboldt Park NeighborhoodEstimated Value: $420,000 - $500,000
2
Beds
7
Baths
1,200
Sq Ft
$373/Sq Ft
Est. Value
About This Home
This home is located at 1710 N Whipple St Unit 3, Chicago, IL 60647 and is currently estimated at $448,095, approximately $373 per square foot. 1710 N Whipple St Unit 3 is a home located in Cook County with nearby schools including Yates Elementary School, Clemente Community Academy High School, and St. Sylvester School.
Ownership History
Date
Name
Owned For
Owner Type
Purchase Details
Closed on
May 16, 2011
Sold by
Deutsche Bank National Trust Company
Bought by
Mumford Paul
Current Estimated Value
Purchase Details
Closed on
Jul 28, 2010
Sold by
Stephenson Joseph J
Bought by
Deutsche Bank National Trust Company
Purchase Details
Closed on
Jan 7, 2005
Sold by
1710 N Whipple Llc
Bought by
Stephenson Joseph J
Home Financials for this Owner
Home Financials are based on the most recent Mortgage that was taken out on this home.
Original Mortgage
$212,000
Interest Rate
5.87%
Mortgage Type
New Conventional
Purchase Details
Closed on
Jul 10, 2003
Sold by
E M Real Estate Investment Inc
Bought by
Domanski Bogdan
Home Financials for this Owner
Home Financials are based on the most recent Mortgage that was taken out on this home.
Original Mortgage
$46,800
Interest Rate
5.47%
Mortgage Type
Unknown
Create a Home Valuation Report for This Property
The Home Valuation Report is an in-depth analysis detailing your home's value as well as a comparison with similar homes in the area
Home Values in the Area
Average Home Value in this Area
Purchase History
| Date | Buyer | Sale Price | Title Company |
|---|---|---|---|
| Mumford Paul | $70,500 | None Available | |
| Deutsche Bank National Trust Company | -- | None Available | |
| Stephenson Joseph J | $265,000 | The Guarantee Title & Trust | |
| Domanski Bogdan | $78,000 | -- |
Source: Public Records
Mortgage History
| Date | Status | Borrower | Loan Amount |
|---|---|---|---|
| Previous Owner | Stephenson Joseph J | $212,000 | |
| Previous Owner | Domanski Bogdan | $46,800 | |
| Closed | Stephenson Joseph J | $53,000 |
Source: Public Records
Tax History Compared to Growth
Tax History
| Year | Tax Paid | Tax Assessment Tax Assessment Total Assessment is a certain percentage of the fair market value that is determined by local assessors to be the total taxable value of land and additions on the property. | Land | Improvement |
|---|---|---|---|---|
| 2024 | $5,524 | $39,111 | $5,444 | $33,667 |
| 2023 | $5,369 | $26,104 | $2,479 | $23,625 |
| 2022 | $5,369 | $26,104 | $2,479 | $23,625 |
| 2021 | $5,249 | $26,104 | $2,479 | $23,625 |
| 2020 | $5,728 | $25,712 | $2,479 | $23,233 |
| 2019 | $5,714 | $28,438 | $2,479 | $25,959 |
| 2018 | $5,617 | $28,438 | $2,479 | $25,959 |
| 2017 | $3,663 | $17,014 | $2,187 | $14,827 |
| 2016 | $3,408 | $17,014 | $2,187 | $14,827 |
| 2015 | $3,118 | $17,014 | $2,187 | $14,827 |
| 2014 | $1,305 | $7,034 | $1,968 | $5,066 |
| 2013 | $1,282 | $7,049 | $1,968 | $5,081 |
Source: Public Records
Map
Nearby Homes
- 3132 W North Ave Unit 2
- 1641 N Kedzie Ave
- 1739 N Whipple St Unit 1
- 3600-3608 W North Ave
- 1717 N Humboldt Blvd Unit 2N
- 1837 N Albany Ave
- 1806 N Richmond St
- 1728 N Francisco Ave
- 1902 N Albany Ave
- 1814 N Sawyer Ave
- 1622 N Spaulding Ave
- 1714 N Spaulding Ave Unit Garage
- 1918 N Humboldt Blvd
- 1922 N Humboldt Blvd
- 3306 W Le Moyne St
- 1701 N Kimball Ave
- 1918 N Kedzie Ave
- 1925 N Humboldt Blvd Unit P14
- 1816 N Spaulding Ave Unit 8
- 1943 N Whipple St
- 1710 N Whipple St Unit 1
- 1710 N Whipple St Unit 3
- 1710 N Whipple St Unit 2
- 1710 N Whipple St Unit 3
- 1708 N Whipple St
- 1708 N Whipple St
- 1714 N Whipple St
- 1714 N Whipple St Unit 2
- 1716 N Whipple St
- 1702 N Whipple St
- 1718 N Whipple St
- 1700 N Whipple St
- 1720 N Whipple St
- 1722 N Whipple St
- 1711 N Albany Ave Unit G
- 1711 N Albany Ave Unit CH
- 1711 N Albany Ave Unit 3
- 1711 N Albany Ave Unit 1
- 1711 N Albany Ave Unit 2
- 1711 N Albany Ave