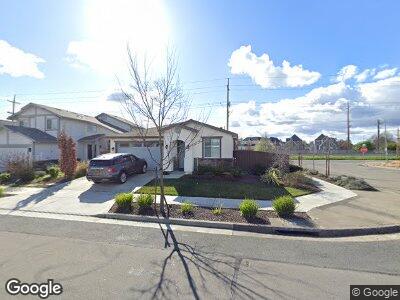
1710 Randon Way Santa Rosa, CA 95403
Northwest Santa Rosa NeighborhoodEstimated Value: $669,208 - $763,000
3
Beds
3
Baths
1,758
Sq Ft
$411/Sq Ft
Est. Value
About This Home
This home is located at 1710 Randon Way, Santa Rosa, CA 95403 and is currently estimated at $722,802, approximately $411 per square foot. 1710 Randon Way is a home located in Sonoma County with nearby schools including Hilliard Comstock Middle School, Piner High School, and Morrice Schaefer Charter School.
Ownership History
Date
Name
Owned For
Owner Type
Purchase Details
Closed on
May 14, 2010
Sold by
Anderson Wayne C
Bought by
Anderson Wayne C and Anderson Robin L
Current Estimated Value
Purchase Details
Closed on
May 12, 2009
Sold by
Anderson Robin L
Bought by
Anderson Wayne C
Home Financials for this Owner
Home Financials are based on the most recent Mortgage that was taken out on this home.
Original Mortgage
$203,000
Outstanding Balance
$130,786
Interest Rate
4.82%
Mortgage Type
Purchase Money Mortgage
Estimated Equity
$607,847
Purchase Details
Closed on
Dec 15, 2008
Sold by
Anderson Wayne Carter and Anderson Robin Lee
Bought by
Anderson Wayne C and Anderson Robin L
Purchase Details
Closed on
Jan 27, 1988
Bought by
Anderson Wayne C Tr & Anderson Robin L Tr
Create a Home Valuation Report for This Property
The Home Valuation Report is an in-depth analysis detailing your home's value as well as a comparison with similar homes in the area
Home Values in the Area
Average Home Value in this Area
Purchase History
| Date | Buyer | Sale Price | Title Company |
|---|---|---|---|
| Anderson Wayne C | -- | First American Title Company | |
| Anderson Wayne C | -- | First American Title Company | |
| Anderson Wayne C | -- | First American Title Company | |
| Anderson Wayne C | -- | None Available | |
| Anderson Wayne C Tr & Anderson Robin L Tr | $120,000 | -- |
Source: Public Records
Mortgage History
| Date | Status | Borrower | Loan Amount |
|---|---|---|---|
| Open | Anderson Wayne C | $203,000 | |
| Closed | Anderson Wayne C | $203,000 | |
| Closed | Anderson Wayne Carter | $220,000 | |
| Closed | Anderson Wayne Carter | $165,000 | |
| Closed | Anderson Wayne Carter | $136,000 | |
| Closed | Anderson Wayne Carter | $135,750 |
Source: Public Records
Tax History Compared to Growth
Tax History
| Year | Tax Paid | Tax Assessment Tax Assessment Total Assessment is a certain percentage of the fair market value that is determined by local assessors to be the total taxable value of land and additions on the property. | Land | Improvement |
|---|---|---|---|---|
| 2023 | $2,558 | $219,839 | $64,385 | $155,454 |
| 2022 | $2,396 | $215,529 | $63,123 | $152,406 |
| 2021 | $2,506 | $211,304 | $61,886 | $149,418 |
| 2020 | $757 | $61,252 | $61,252 | $0 |
| 2019 | $750 | $60,051 | $60,051 | $0 |
| 2018 | $742 | $58,874 | $58,874 | $0 |
| 2017 | $2,398 | $197,077 | $57,720 | $139,357 |
| 2016 | $2,368 | $193,214 | $56,589 | $136,625 |
| 2015 | $2,284 | $190,312 | $55,739 | $134,573 |
| 2014 | $2,200 | $186,585 | $54,648 | $131,937 |
Source: Public Records
Map
Nearby Homes
- 1748 Randon Way
- 2370 Battersea St
- 2433 Penbrooke Ave
- 1655 Kerry Ln
- 2340 Brompton Ave
- 1777 Elwin Ln
- 1647 Kerry Ln
- 2300 Claiborne Cir
- 2289 Claiborne Cir
- 2318 Francisco Ave
- 2187 Tarata Place
- 2113 Dennis Ln
- 2039 Dennis Ln
- 2543 Francisco Ave
- 2579 Estery Ln
- 3748 Mocha Ln
- 3476 San Sonita Dr
- 2299 San Miguel Ave
- 2263 Orleans St
- 2269 Dancing Penny Way