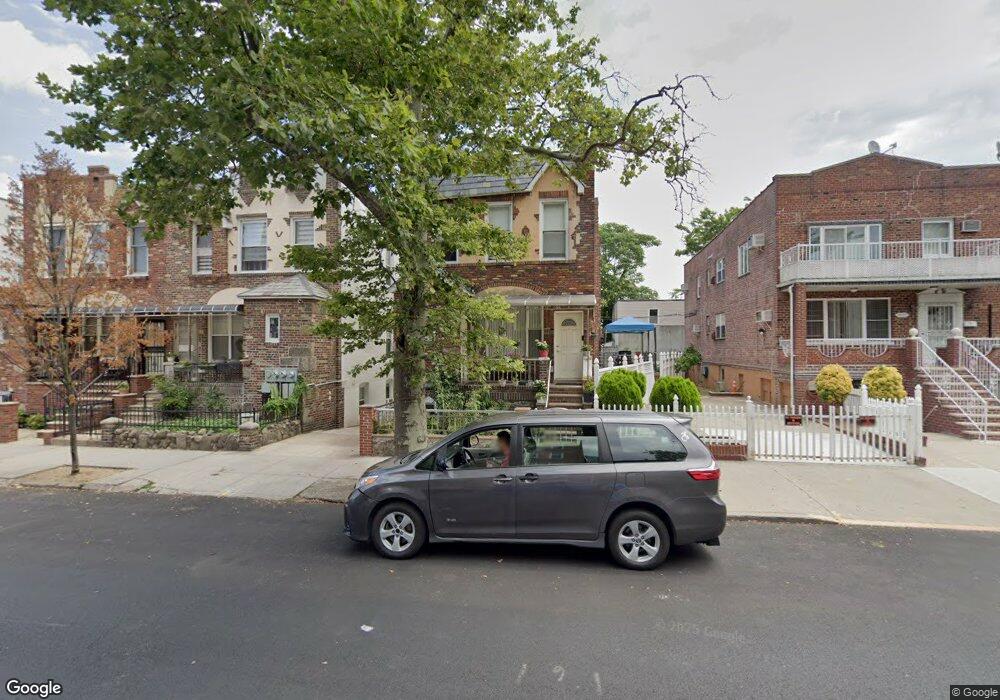
1711 Dahill Rd Brooklyn, NY 11223
Gravesend NeighborhoodEstimated Value: $1,494,290 - $1,854,000
--
Bed
--
Bath
2,801
Sq Ft
$602/Sq Ft
Est. Value
About This Home
This home is located at 1711 Dahill Rd, Brooklyn, NY 11223 and is currently estimated at $1,685,323, approximately $601 per square foot. 1711 Dahill Rd is a home located in Kings County with nearby schools including P.S.177 The Marlboro, Is 228 David A Boody, and Mirrer Yeshiva Educational Institute.
Ownership History
Date
Name
Owned For
Owner Type
Purchase Details
Closed on
Aug 7, 2024
Sold by
Feng Xiao Bing and Huang Guo Jun
Bought by
Huang Gary
Current Estimated Value
Home Financials for this Owner
Home Financials are based on the most recent Mortgage that was taken out on this home.
Original Mortgage
$750,000
Outstanding Balance
$741,366
Interest Rate
6.78%
Mortgage Type
Purchase Money Mortgage
Estimated Equity
$943,957
Purchase Details
Closed on
Mar 18, 2010
Sold by
Kapitaj Ramadan and Kapitaj Shqipe
Bought by
Feng Xiao Bing and Huang Guo Hun
Home Financials for this Owner
Home Financials are based on the most recent Mortgage that was taken out on this home.
Original Mortgage
$478,000
Interest Rate
5.02%
Mortgage Type
Purchase Money Mortgage
Purchase Details
Closed on
Oct 3, 2005
Sold by
Biondo and Phyllis
Bought by
Kapitaj Ramadan and Kapitaj Shqipe
Create a Home Valuation Report for This Property
The Home Valuation Report is an in-depth analysis detailing your home's value as well as a comparison with similar homes in the area
Home Values in the Area
Average Home Value in this Area
Purchase History
| Date | Buyer | Sale Price | Title Company |
|---|---|---|---|
| Huang Gary | $775,000 | -- | |
| Feng Xiao Bing | $775,000 | -- | |
| Feng Xiao Bing | $775,000 | -- | |
| Kapitaj Ramadan | -- | -- | |
| Kapitaj Ramadan | -- | -- |
Source: Public Records
Mortgage History
| Date | Status | Borrower | Loan Amount |
|---|---|---|---|
| Open | Huang Gary | $750,000 | |
| Closed | Feng Xiao Bing | $478,000 | |
| Closed | Kapitaj Ramadan | $0 |
Source: Public Records
Tax History Compared to Growth
Tax History
| Year | Tax Paid | Tax Assessment Tax Assessment Total Assessment is a certain percentage of the fair market value that is determined by local assessors to be the total taxable value of land and additions on the property. | Land | Improvement |
|---|---|---|---|---|
| 2025 | $10,967 | $107,940 | $14,340 | $93,600 |
| 2024 | $10,967 | $88,500 | $14,340 | $74,160 |
| 2023 | $10,478 | $107,880 | $14,340 | $93,540 |
| 2022 | $10,120 | $97,860 | $14,340 | $83,520 |
| 2021 | $10,149 | $96,780 | $14,340 | $82,440 |
| 2020 | $4,760 | $80,880 | $14,340 | $66,540 |
| 2019 | $9,519 | $72,540 | $14,340 | $58,200 |
| 2018 | $8,467 | $42,996 | $8,859 | $34,137 |
| 2017 | $8,323 | $42,301 | $9,387 | $32,914 |
| 2016 | $7,724 | $40,188 | $8,591 | $31,597 |
| 2015 | $4,593 | $37,920 | $9,652 | $28,268 |
| 2014 | $4,593 | $37,920 | $11,581 | $26,339 |
Source: Public Records
Map
Nearby Homes
- 1652 Dahill Rd
- 1734 E 2nd St
- 1640 W 1st St
- 431 Kings Hwy
- 1728 W 2nd St
- 380 Avenue P
- 1806 McDonald Ave
- 340 Avenue P
- 412 Kings Hwy Unit 6C
- 379 Kings Hwy Unit 2A
- 1543 W 1st St Unit E8
- 1543 W 1st St Unit D1
- 411 Avenue P
- 339 Avenue P Unit 2B
- 339 Avenue P Unit 2A
- 431 Ave P Unit 407
- 1726 E 4th St
- 355 Kings Hwy Unit 5C
- 447 Avenue P Unit 405
- 1733 E 4th St Unit 1A
- 1717 Dahill Rd
- 1719 Dahill Rd
- 1721 Dahill Rd
- 1707 Dahill Rd
- 1723 Dahill Rd
- 348 Quentin Rd
- 1705 Dahill Rd
- 1904 McDonald Ave
- 1701 Dahill Rd
- 1727 Dahill Rd
- 1727 Dahill Rd Unit 2-F
- 1731 Dahill Rd
- 1910-1922 McDonald Ave
- 1714 Dahill Rd Unit 3
- 1718 Dahill Rd Unit 3
- 1720 Dahill Rd Unit 3
- 1724 Dahill Rd Unit 3
- 1702 Dahill Rd Unit 1-FLR
- 1702-1712 Dahill Rd
- 1726 Dahill Rd Unit 3