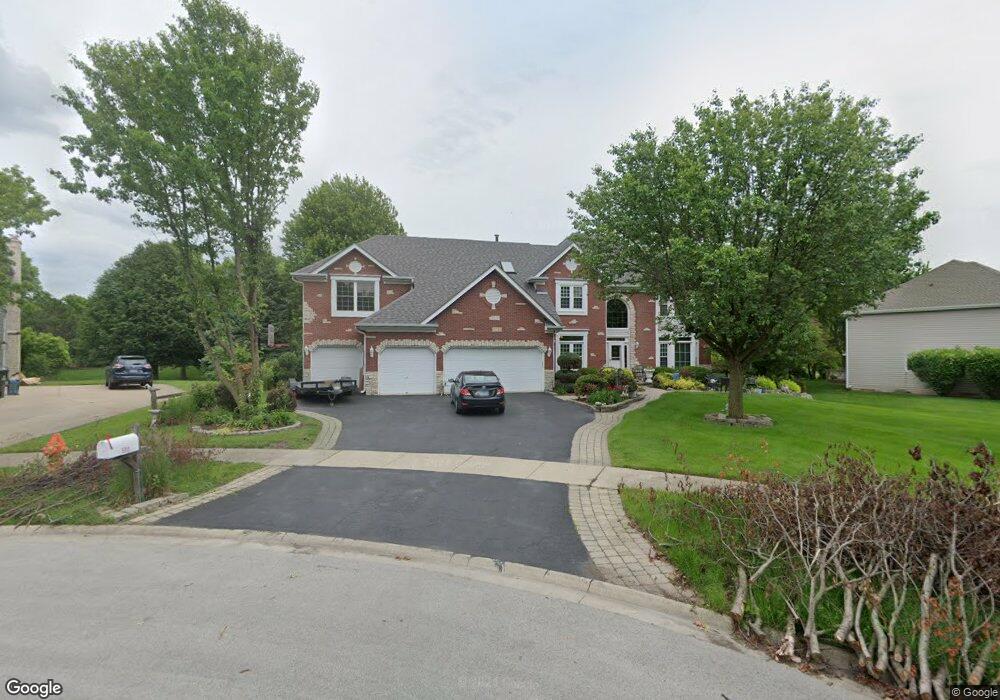
1711 Princess Cir Unit 3 Naperville, IL 60564
River Run NeighborhoodEstimated Value: $911,004 - $1,066,000
--
Bed
1
Bath
3,760
Sq Ft
$259/Sq Ft
Est. Value
About This Home
This home is located at 1711 Princess Cir Unit 3, Naperville, IL 60564 and is currently estimated at $972,501, approximately $258 per square foot. 1711 Princess Cir Unit 3 is a home located in Will County with nearby schools including Graham Elementary School, Ellsworth Elementary School, and Clifford Crone Middle School.
Ownership History
Date
Name
Owned For
Owner Type
Purchase Details
Closed on
Apr 1, 2017
Sold by
Coscino Joseph M and Coscino Andrea
Bought by
Coscino Joseph M and Revocable Living Trust Of Jose
Current Estimated Value
Purchase Details
Closed on
Jun 2, 2001
Sold by
Allen Spencer S and Allen Patricia L
Bought by
Coscino Joseph M and Coscino Andrea M
Home Financials for this Owner
Home Financials are based on the most recent Mortgage that was taken out on this home.
Original Mortgage
$432,000
Interest Rate
7.16%
Purchase Details
Closed on
Oct 12, 1995
Sold by
Oliver Hoffman Corp
Bought by
Allen Spencer S and Allen Patricia L
Home Financials for this Owner
Home Financials are based on the most recent Mortgage that was taken out on this home.
Original Mortgage
$284,400
Interest Rate
6.5%
Create a Home Valuation Report for This Property
The Home Valuation Report is an in-depth analysis detailing your home's value as well as a comparison with similar homes in the area
Home Values in the Area
Average Home Value in this Area
Purchase History
| Date | Buyer | Sale Price | Title Company |
|---|---|---|---|
| Coscino Joseph M | -- | Attorney | |
| Coscino Joseph M | $540,000 | Executive Land Title Inc | |
| Allen Spencer S | $347,000 | -- |
Source: Public Records
Mortgage History
| Date | Status | Borrower | Loan Amount |
|---|---|---|---|
| Previous Owner | Coscino Joseph M | $432,000 | |
| Previous Owner | Allen Spencer S | $284,400 |
Source: Public Records
Tax History Compared to Growth
Tax History
| Year | Tax Paid | Tax Assessment Tax Assessment Total Assessment is a certain percentage of the fair market value that is determined by local assessors to be the total taxable value of land and additions on the property. | Land | Improvement |
|---|---|---|---|---|
| 2024 | $17,798 | $279,735 | $60,808 | $218,927 |
| 2023 | $17,798 | $247,115 | $53,717 | $193,398 |
| 2022 | $16,174 | $229,233 | $50,815 | $178,418 |
| 2021 | $15,465 | $218,317 | $48,395 | $169,922 |
| 2020 | $15,174 | $214,858 | $47,628 | $167,230 |
| 2019 | $14,918 | $208,803 | $46,286 | $162,517 |
| 2018 | $15,000 | $206,237 | $45,268 | $160,969 |
| 2017 | $14,774 | $200,912 | $44,099 | $156,813 |
| 2016 | $14,750 | $196,587 | $43,150 | $153,437 |
| 2015 | $15,734 | $189,026 | $41,490 | $147,536 |
| 2014 | $15,734 | $194,145 | $41,490 | $152,655 |
| 2013 | $15,734 | $194,145 | $41,490 | $152,655 |
Source: Public Records
Map
Nearby Homes
- 1804 Princess Cir
- 1736 Robert Ln
- 1112 Saratoga Ct
- 3816 Rosada Dr
- 3616 Eliot Ln
- 2255 Wendt Cir
- 3432 Caine Dr
- 3508 Tussell St
- 1116 Hollingswood Ave
- 1987 Baldwin Way
- 29W316 Andermann Dr
- 164 Willow Bend
- 4007 Heron Ct Unit 1
- 945 Winners Cup Ct Unit 945
- 3004 Bennett Dr
- 2949 Brossman St
- 620 Redtop Way
- 1123 Thackery Ln
- 2241 Bent Grass Way
- 596 Redtop Way
- 1707 Princess Cir
- 1715 Princess Cir Unit 3
- 4111 Falkner Dr
- 4115 Falkner Dr Unit 3
- 4107 Falkner Dr
- 1703 Princess Cir Unit 3
- 1719 Princess Cir Unit 3
- 4119 Falkner Dr Unit 3
- 1708 Princess Cir
- 1723 Princess Cir
- 1724 Princess Cir
- 1619 Robert Ln
- 4103 Falkner Dr
- 1728 Princess Cir
- 1727 Princess Cir
- 4116 Falkner Dr
- 4112 Falkner Dr
- 1623 Robert Ln
- 4108 Falkner Dr
- 4208 Delaware Ct