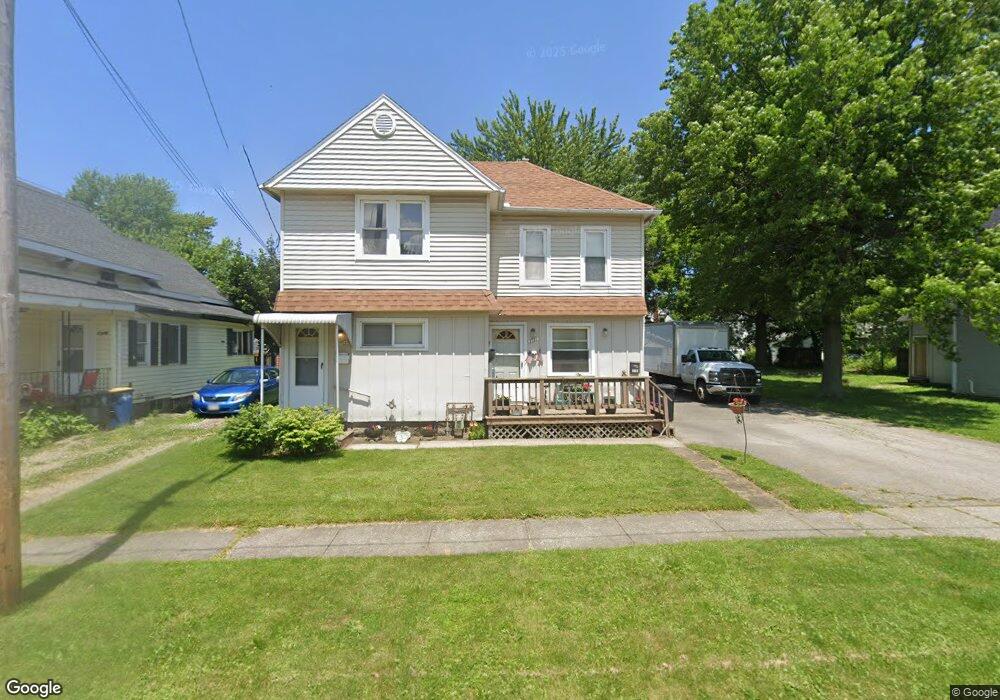
1711 W 8th St Unit 1713 Ashtabula, OH 44004
Estimated Value: $131,000 - $161,581
4
Beds
2
Baths
1,726
Sq Ft
$88/Sq Ft
Est. Value
About This Home
This home is located at 1711 W 8th St Unit 1713, Ashtabula, OH 44004 and is currently estimated at $151,645, approximately $87 per square foot. 1711 W 8th St Unit 1713 is a home located in Ashtabula County with nearby schools including Lakeside High School and Christian Faith Academy.
Create a Home Valuation Report for This Property
The Home Valuation Report is an in-depth analysis detailing your home's value as well as a comparison with similar homes in the area
Home Values in the Area
Average Home Value in this Area
Tax History
| Year | Tax Paid | Tax Assessment Tax Assessment Total Assessment is a certain percentage of the fair market value that is determined by local assessors to be the total taxable value of land and additions on the property. | Land | Improvement |
|---|---|---|---|---|
| 2024 | $2,699 | $30,530 | $4,660 | $25,870 |
| 2023 | $1,653 | $30,530 | $4,660 | $25,870 |
| 2022 | $1,444 | $24,330 | $3,610 | $20,720 |
| 2021 | $1,435 | $24,330 | $3,610 | $20,720 |
| 2020 | $1,456 | $24,330 | $3,610 | $20,720 |
| 2019 | $1,698 | $27,130 | $4,030 | $23,100 |
| 2018 | $1,548 | $27,130 | $4,030 | $23,100 |
| 2017 | $806 | $27,130 | $4,030 | $23,100 |
| 2016 | $1,516 | $25,450 | $3,780 | $21,670 |
| 2015 | $1,944 | $25,450 | $3,780 | $21,670 |
| 2014 | $1,437 | $25,450 | $3,780 | $21,670 |
| 2013 | $1,395 | $22,760 | $3,120 | $19,640 |
Source: Public Records
Map
Nearby Homes
- 1010 Ohio Ave
- 1728 W 10th St
- 1028 Ohio Ave
- 1820 W 10th St
- 306 Pennsylvania Ave
- 1031 Thayer Ave
- V/L W 12
- 1128 Myrtle Ave
- 725 Union Ave
- 2512 W 9th St
- 2684 Burlingham Dr
- Carpenter W 19th Rd
- 1516 Union Ave
- 0 Scott Ave Unit 5167555
- 919 E 17th St
- 1010 Brown Dr
- 1421 Norwood Dr
- 1715 Pleasantview Ave
- 814 Richards Ave
- 3337 Lake Rd W
Your Personal Tour Guide
Ask me questions while you tour the home.