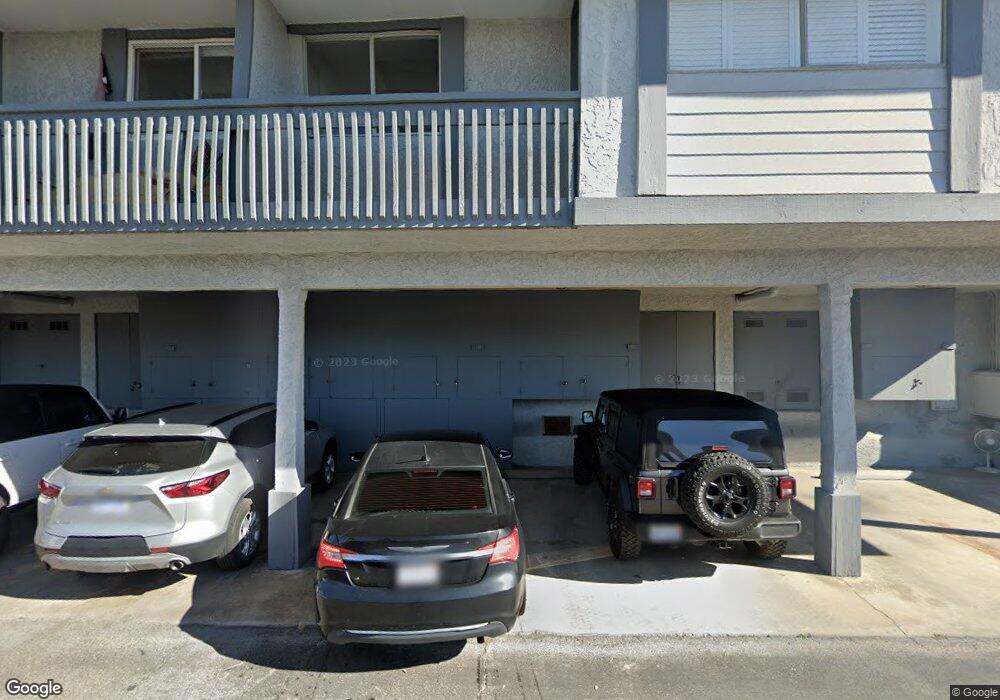
17112 Pacific Coast Hwy Unit 203 Huntington Beach, CA 92649
Sunset Beach NeighborhoodEstimated Value: $435,414 - $652,000
1
Bed
1
Bath
478
Sq Ft
$1,144/Sq Ft
Est. Value
About This Home
This home is located at 17112 Pacific Coast Hwy Unit 203, Huntington Beach, CA 92649 and is currently estimated at $546,604, approximately $1,143 per square foot. 17112 Pacific Coast Hwy Unit 203 is a home located in Orange County with nearby schools including Agnes L. Smith Elementary, Ethel Dwyer Middle, and Huntington Beach High School.
Ownership History
Date
Name
Owned For
Owner Type
Purchase Details
Closed on
Mar 26, 1999
Sold by
Hud
Bought by
Derego Cheryl
Current Estimated Value
Home Financials for this Owner
Home Financials are based on the most recent Mortgage that was taken out on this home.
Original Mortgage
$89,000
Outstanding Balance
$22,185
Interest Rate
7.1%
Estimated Equity
$524,419
Purchase Details
Closed on
May 28, 1998
Sold by
Marquez Diane
Bought by
Countrywide Home Loans Inc
Purchase Details
Closed on
May 27, 1998
Sold by
Countrywide Home Loans Inc
Bought by
Hud
Purchase Details
Closed on
Oct 4, 1995
Sold by
Peterson Gary R and Peterson Garlyn C
Bought by
Marquez Diane
Home Financials for this Owner
Home Financials are based on the most recent Mortgage that was taken out on this home.
Original Mortgage
$83,905
Interest Rate
7.59%
Mortgage Type
FHA
Create a Home Valuation Report for This Property
The Home Valuation Report is an in-depth analysis detailing your home's value as well as a comparison with similar homes in the area
Home Values in the Area
Average Home Value in this Area
Purchase History
| Date | Buyer | Sale Price | Title Company |
|---|---|---|---|
| Derego Cheryl | -- | First American Title Ins Co | |
| Countrywide Home Loans Inc | $89,492 | Landsafe Title | |
| Hud | -- | Landsafe Title | |
| Marquez Diane | $86,500 | Orange Coast Title |
Source: Public Records
Mortgage History
| Date | Status | Borrower | Loan Amount |
|---|---|---|---|
| Open | Derego Cheryl | $89,000 | |
| Previous Owner | Marquez Diane | $83,905 |
Source: Public Records
Tax History Compared to Growth
Tax History
| Year | Tax Paid | Tax Assessment Tax Assessment Total Assessment is a certain percentage of the fair market value that is determined by local assessors to be the total taxable value of land and additions on the property. | Land | Improvement |
|---|---|---|---|---|
| 2025 | $1,818 | $139,509 | $94,099 | $45,410 |
| 2024 | $1,818 | $136,774 | $92,254 | $44,520 |
| 2023 | $1,772 | $134,093 | $90,445 | $43,648 |
| 2022 | $1,723 | $131,464 | $88,671 | $42,793 |
| 2021 | $1,692 | $128,887 | $86,933 | $41,954 |
| 2020 | $1,679 | $127,566 | $86,042 | $41,524 |
| 2019 | $1,661 | $125,065 | $84,355 | $40,710 |
| 2018 | $1,635 | $122,613 | $82,701 | $39,912 |
| 2017 | $1,612 | $120,209 | $81,079 | $39,130 |
| 2016 | $1,548 | $117,852 | $79,489 | $38,363 |
| 2015 | $1,530 | $116,082 | $78,295 | $37,787 |
| 2014 | $1,497 | $113,809 | $76,762 | $37,047 |
Source: Public Records
Map
Nearby Homes
- 17009 Bluewater Ln Unit 88
- 17022 Marinabay Dr
- 17086 Bluewater Ln Unit 127
- 16922 Pacific Coast Hwy Unit 176
- 16935 S Pacific Ave
- 16865 S Pacific Ave
- 16802 Kamalii Dr
- 4006 Aladdin Dr
- 16855 12th St
- 4045 Warner Ave
- 16778 Bayview Dr Unit B
- 4062 Aladdin Dr
- 16661 Carousel Ln
- 16712 Baruna Ln
- 16745 Bayview Dr Unit B
- 16561 Wanderer Ln
- 4165 Warner Ave Unit 202
- 16502 Mariana Cir
- 16921 Bedford Ln
- 3562 Venture Dr
- 17092 Pacific Coast Hwy Unit 101
- 17092 Pacific Coast Hwy Unit 204
- 17092 Pacific Coast Hwy Unit 102
- 17112 Pacific Coast Hwy Unit 72
- 17112 Pacific Coast Hwy Unit 104
- 17112 Pacific Coast Hwy Unit 202
- 17112 Pacific Coast Hwy
- 17092 Pacific Coast Hwy
- 17112 Pacific Coast Hwy Unit 71
- 17092 Pacific Coast Hwy Unit 75
- 17092 Pacific Coast Hwy Unit 66
- 17112 Pacific Coast Hwy Unit 69
- 17112 Pacific Coast Hwy Unit 201
- 17112 Pacific Coast Hwy Unit 63
- 17112 Pacific Coast Hwy Unit 62
- 17092 Pacific Coast Hwy Unit 76
- 17092 Pacific Coast Hwy Unit 202
- 17092 Pacific Coast Hwy Unit 73
- 17092 Pacific Coast Hwy Unit 67
- 17092 Pacific Coast Hwy Unit 65