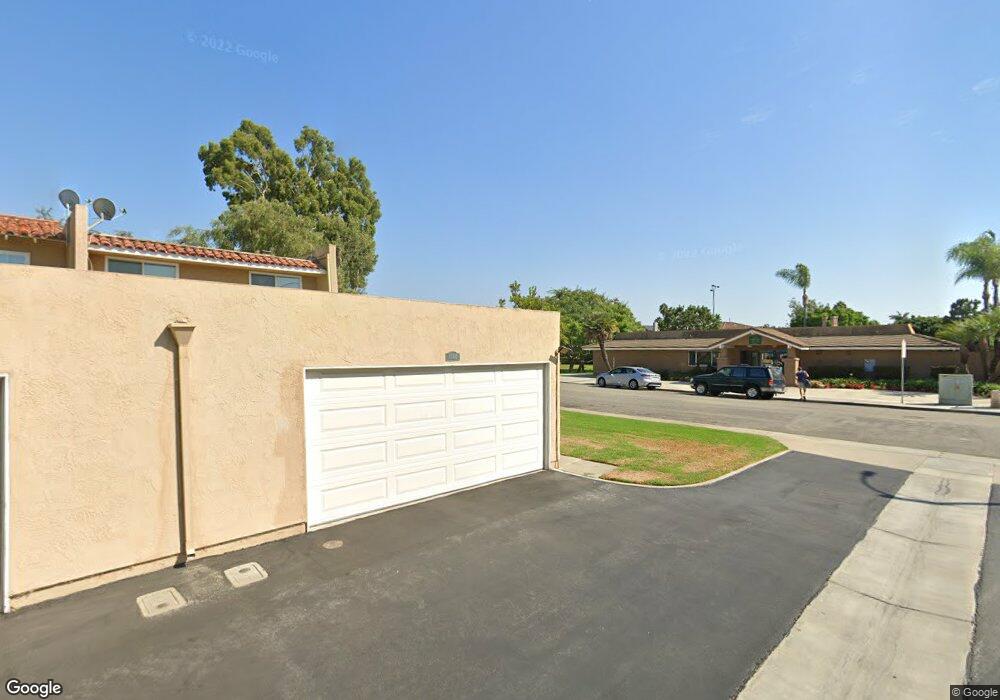
17114 Los Modelos St Fountain Valley, CA 92708
Estimated Value: $851,000 - $1,313,000
4
Beds
3
Baths
1,625
Sq Ft
$671/Sq Ft
Est. Value
About This Home
This home is located at 17114 Los Modelos St, Fountain Valley, CA 92708 and is currently estimated at $1,089,876, approximately $670 per square foot. 17114 Los Modelos St is a home located in Orange County with nearby schools including Cox (James H.) Elementary School, Masuda (Kazuo) Middle School, and Fountain Valley High School.
Ownership History
Date
Name
Owned For
Owner Type
Purchase Details
Closed on
Sep 14, 2015
Sold by
Luippold Deborah Bard
Bought by
Luippold Deborah B
Current Estimated Value
Purchase Details
Closed on
Nov 22, 2002
Sold by
Luippold Deborah Bard and Luippold Deborah
Bought by
Luippold Deborah Bard
Home Financials for this Owner
Home Financials are based on the most recent Mortgage that was taken out on this home.
Original Mortgage
$80,000
Interest Rate
6.12%
Purchase Details
Closed on
Feb 23, 1993
Sold by
Chasco Patrick M and Chasco Barbara S Mcardle
Bought by
Luippold Deborah
Home Financials for this Owner
Home Financials are based on the most recent Mortgage that was taken out on this home.
Original Mortgage
$105,000
Interest Rate
7.38%
Create a Home Valuation Report for This Property
The Home Valuation Report is an in-depth analysis detailing your home's value as well as a comparison with similar homes in the area
Home Values in the Area
Average Home Value in this Area
Purchase History
| Date | Buyer | Sale Price | Title Company |
|---|---|---|---|
| Luippold Deborah B | -- | None Available | |
| Luippold Deborah Bard | -- | Stewart Title | |
| Luippold Deborah | $185,000 | Continental Lawyers Title Co |
Source: Public Records
Mortgage History
| Date | Status | Borrower | Loan Amount |
|---|---|---|---|
| Closed | Luippold Deborah Bard | $80,000 | |
| Previous Owner | Luippold Deborah | $105,000 |
Source: Public Records
Tax History Compared to Growth
Tax History
| Year | Tax Paid | Tax Assessment Tax Assessment Total Assessment is a certain percentage of the fair market value that is determined by local assessors to be the total taxable value of land and additions on the property. | Land | Improvement |
|---|---|---|---|---|
| 2025 | $3,639 | $314,426 | $195,383 | $119,043 |
| 2024 | $3,639 | $308,261 | $191,552 | $116,709 |
| 2023 | $3,550 | $302,217 | $187,796 | $114,421 |
| 2022 | $3,494 | $296,292 | $184,114 | $112,178 |
| 2021 | $3,427 | $290,483 | $180,504 | $109,979 |
| 2020 | $3,405 | $287,505 | $178,653 | $108,852 |
| 2019 | $3,338 | $281,868 | $175,150 | $106,718 |
| 2018 | $3,274 | $276,342 | $171,716 | $104,626 |
| 2017 | $3,222 | $270,924 | $168,349 | $102,575 |
| 2016 | $3,087 | $265,612 | $165,048 | $100,564 |
| 2015 | $3,039 | $261,623 | $162,569 | $99,054 |
| 2014 | $2,978 | $256,499 | $159,385 | $97,114 |
Source: Public Records
Map
Nearby Homes
- 17077 Los Modelos St
- 17288 San Lorenzo Cir
- 17401 Hood Ct
- 10452 Circulo de Juarez
- 10322 Avenida Cinco de Mayo
- 18021 Roch Ct
- 18016 Roch Ct
- 17641 Los Jardines W
- 10900 La Flor Ave
- 17210 San Mateo St Unit 25
- 10430 La Cebra Ave
- 17168 Newhope St Unit 222
- 11356 Stonecress Ave
- 11620 Warner Ave Unit 624
- 17200 Newhope St Unit 109
- 17200 Newhope St Unit 217
- 17333 Brookhurst St Unit D6
- 11872 Goodale Ave
- 16379 Shadbush St
- 10231 Bunting Ave
- 17110 Los Modelos St
- 17106 Los Modelos St
- 17102 Los Modelos St
- 17098 Los Modelos St
- 17094 Los Modelos St
- 17115 Los Modelos St
- 17111 Los Modelos St
- 17105 Los Modelos St
- 17101 Los Modelos St
- 17097 Los Modelos St
- 17093 Los Modelos St
- 10818 Los Jardines E
- 17084 Los Modelos St
- 10885 El Domino Ave
- 17080 Los Modelos St
- 17081 Los Modelos St
- 10809 Los Jardines E
- 10810 Los Jardines E
- 10895 El Domino Ave
- 17076 Los Modelos St