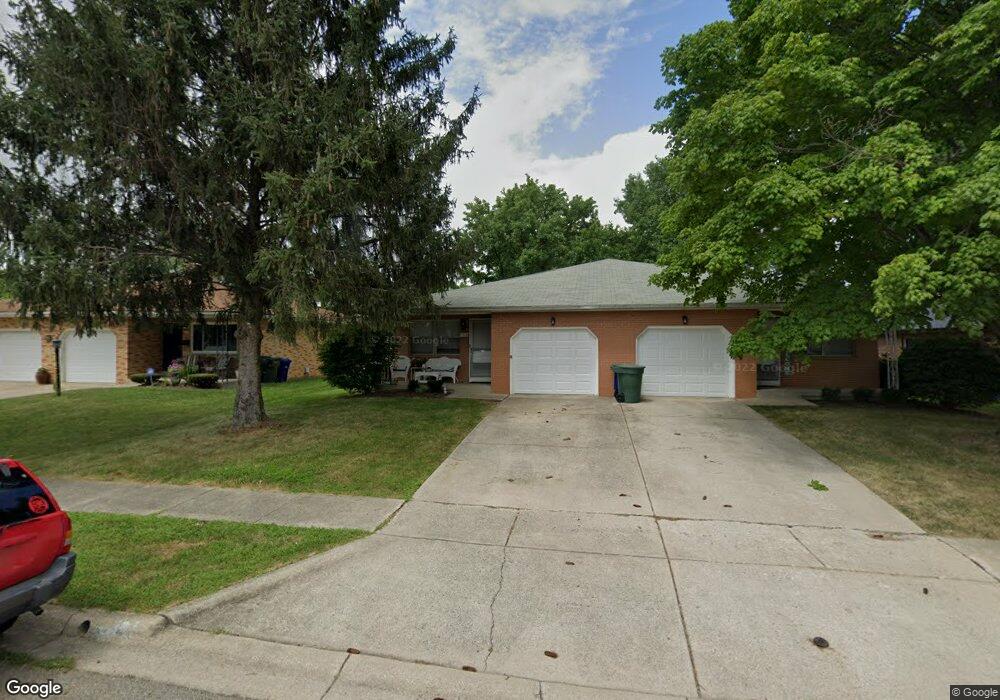
1712 Durbridge Rd Unit 714 Columbus, OH 43229
Northgate NeighborhoodEstimated Value: $299,000 - $373,000
4
Beds
2
Baths
2,156
Sq Ft
$151/Sq Ft
Est. Value
About This Home
This home is located at 1712 Durbridge Rd Unit 714, Columbus, OH 43229 and is currently estimated at $325,615, approximately $151 per square foot. 1712 Durbridge Rd Unit 714 is a home located in Franklin County with nearby schools including Alpine Elementary School, Northgate Intermediate, and Woodward Park Middle School.
Ownership History
Date
Name
Owned For
Owner Type
Purchase Details
Closed on
Apr 25, 2018
Sold by
Selective Property Management Llc
Bought by
Eagle Rock Investments Llc
Current Estimated Value
Purchase Details
Closed on
Sep 23, 2008
Sold by
Lee Joel and Lee Tracy
Bought by
Selective Property Management Llc
Purchase Details
Closed on
Feb 17, 2006
Sold by
Pirtle Kenneth J and Smith Kathleen R
Bought by
Lee Joel and Lee Tracy
Home Financials for this Owner
Home Financials are based on the most recent Mortgage that was taken out on this home.
Original Mortgage
$137,600
Interest Rate
6.22%
Mortgage Type
Fannie Mae Freddie Mac
Purchase Details
Closed on
Jul 2, 1984
Bought by
Pirtle Kenneth J
Create a Home Valuation Report for This Property
The Home Valuation Report is an in-depth analysis detailing your home's value as well as a comparison with similar homes in the area
Home Values in the Area
Average Home Value in this Area
Purchase History
| Date | Buyer | Sale Price | Title Company |
|---|---|---|---|
| Eagle Rock Investments Llc | $146,000 | None Available | |
| Selective Property Management Llc | -- | Attorney | |
| Lee Joel | $172,000 | Lawyers Tit | |
| Pirtle Kenneth J | $43,500 | -- |
Source: Public Records
Mortgage History
| Date | Status | Borrower | Loan Amount |
|---|---|---|---|
| Previous Owner | Lee Joel | $137,600 |
Source: Public Records
Tax History Compared to Growth
Tax History
| Year | Tax Paid | Tax Assessment Tax Assessment Total Assessment is a certain percentage of the fair market value that is determined by local assessors to be the total taxable value of land and additions on the property. | Land | Improvement |
|---|---|---|---|---|
| 2024 | $4,681 | $102,140 | $22,440 | $79,700 |
| 2023 | $4,622 | $102,130 | $22,435 | $79,695 |
| 2022 | $2,978 | $56,040 | $11,800 | $44,240 |
| 2021 | $2,983 | $56,040 | $11,800 | $44,240 |
| 2020 | $2,988 | $56,040 | $11,800 | $44,240 |
| 2019 | $2,788 | $44,840 | $9,450 | $35,390 |
| 2018 | $2,211 | $44,840 | $9,450 | $35,390 |
| 2017 | $2,973 | $44,840 | $9,450 | $35,390 |
| 2016 | $3,158 | $46,490 | $9,420 | $37,070 |
| 2015 | $2,875 | $46,490 | $9,420 | $37,070 |
| 2014 | $2,883 | $46,490 | $9,420 | $37,070 |
| 2013 | $1,580 | $51,660 | $10,465 | $41,195 |
Source: Public Records
Map
Nearby Homes
- 6035 Karl Rd
- 1752 Pine Tree St S Unit H
- 1743 Pine Tree St N Unit A
- 1549 Alpine Dr
- 1687 Brookfield Square S
- 6019 Beechcroft Rd
- 1390 E Dublin Granville Rd
- 1881 Brimfield Rd
- 5732 Beechcroft Rd Unit B
- 5726 Beechcroft Rd Unit J
- 6342 Bellmeadow Dr
- 1492 Cottonwood Dr
- 1288 Oakfield Dr N
- 1722 Blue Ash Place
- 6245 Sharon Woods Blvd
- 5485 Tamarack Blvd
- 1914 Walden Dr
- 6407 Skywae Dr
- 6458 Faircrest Rd
- 6189 Northgap Dr
- 1712-1714 Durbridge Rd
- 1722 Durbridge Rd Unit 724
- 1722-1724 Durbridge Rd
- 1700 Durbridge Rd Unit 702
- 1707 Sandhurst Rd
- 1734 Durbridge Rd Unit 736
- 1734-1736 Durbridge Rd
- 1717 Sandhurst Rd
- 1690 Durbridge Rd Unit 692
- 1699 Sandhurst Rd
- 1709 Durbridge Rd Unit 711
- 1717 Durbridge Rd
- 1699 Durbridge Rd Unit 701
- 1742 Durbridge Rd Unit 744
- 1727 Sandhurst Rd
- 1687 Sandhurst Rd
- 1682 Durbridge Rd Unit 684
- 1689 Durbridge Rd Unit 691
- 1679 Sandhurst Rd
- 1755 Lynnhurst Rd Unit 757