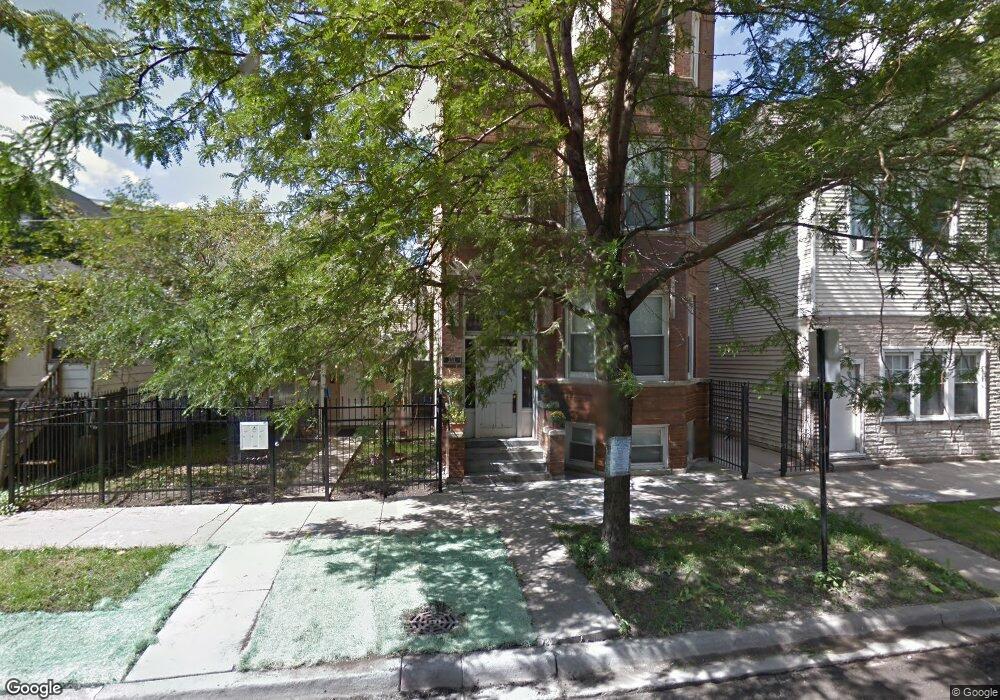
1712 N Washtenaw Ave Unit 3F Chicago, IL 60647
Humboldt Park NeighborhoodEstimated Value: $237,448 - $397,000
2
Beds
1
Bath
880
Sq Ft
$373/Sq Ft
Est. Value
About This Home
This home is located at 1712 N Washtenaw Ave Unit 3F, Chicago, IL 60647 and is currently estimated at $328,112, approximately $372 per square foot. 1712 N Washtenaw Ave Unit 3F is a home located in Cook County with nearby schools including Moos Elementary School, Clemente Community Academy High School, and Erie Elementary Charter School.
Ownership History
Date
Name
Owned For
Owner Type
Purchase Details
Closed on
Oct 28, 2010
Sold by
Klytta Mary Ann
Bought by
Canali Investments Corp
Current Estimated Value
Purchase Details
Closed on
Aug 29, 2006
Sold by
Klytta Anthony M
Bought by
Klytta Anthony M and Klytta Mary Ann
Purchase Details
Closed on
Mar 10, 2006
Sold by
1712 N Washtenaw Llc
Bought by
Klytta John R
Home Financials for this Owner
Home Financials are based on the most recent Mortgage that was taken out on this home.
Original Mortgage
$199,200
Interest Rate
9.78%
Mortgage Type
New Conventional
Purchase Details
Closed on
Feb 10, 2006
Sold by
1712 N Washtenaw Llc
Bought by
Klytta Anthony M
Home Financials for this Owner
Home Financials are based on the most recent Mortgage that was taken out on this home.
Original Mortgage
$199,200
Interest Rate
9.78%
Mortgage Type
New Conventional
Create a Home Valuation Report for This Property
The Home Valuation Report is an in-depth analysis detailing your home's value as well as a comparison with similar homes in the area
Home Values in the Area
Average Home Value in this Area
Purchase History
| Date | Buyer | Sale Price | Title Company |
|---|---|---|---|
| Canali Investments Corp | $19,000 | None Available | |
| Klytta Anthony M | -- | None Available | |
| Klytta John R | -- | None Available | |
| Klytta John R | $249,000 | Ctic | |
| Klytta Anthony M | $249,000 | Chicago Title Insurance Co |
Source: Public Records
Mortgage History
| Date | Status | Borrower | Loan Amount |
|---|---|---|---|
| Previous Owner | Klytta John R | $199,200 | |
| Previous Owner | Klytta Anthony M | $200,000 |
Source: Public Records
Tax History Compared to Growth
Tax History
| Year | Tax Paid | Tax Assessment Tax Assessment Total Assessment is a certain percentage of the fair market value that is determined by local assessors to be the total taxable value of land and additions on the property. | Land | Improvement |
|---|---|---|---|---|
| 2024 | $2,581 | $24,477 | $2,307 | $22,170 |
| 2023 | $2,508 | $12,197 | $1,051 | $11,146 |
| 2022 | $2,508 | $12,197 | $1,051 | $11,146 |
| 2021 | $2,453 | $12,196 | $1,050 | $11,146 |
| 2020 | $2,785 | $12,501 | $1,050 | $11,451 |
| 2019 | $2,778 | $13,826 | $1,050 | $12,776 |
| 2018 | $2,731 | $13,826 | $1,050 | $12,776 |
| 2017 | $1,724 | $8,007 | $926 | $7,081 |
| 2016 | $1,604 | $8,007 | $926 | $7,081 |
| 2015 | $1,467 | $8,007 | $926 | $7,081 |
| 2014 | $1,467 | $7,904 | $834 | $7,070 |
| 2013 | -- | $7,904 | $834 | $7,070 |
Source: Public Records
Map
Nearby Homes
- 1644 N Washtenaw Ave
- 1655 N Fairfield Ave Unit 102
- 1714 N Washtenaw Ave Unit 1
- 1640 N Talman Ave
- 1700 N Talman Ave Unit 1
- 1714 N Talman Ave Unit 1S
- 2605 W North Ave Unit 2C
- 1742 N California Ave
- 2544 W North Ave Unit 3D
- 1740 N Maplewood Ave Unit 218
- 1534 N Maplewood Ave
- 1816 N Rockwell St Unit C
- 1841 N California Ave Unit 3B
- 1541 N Maplewood Ave
- 1728 N Francisco Ave
- 1441 N California Ave Unit 2
- 1653 N Campbell Ave
- 2516 W Bloomingdale Ave Unit C
- 2520 W Bloomingdale Ave Unit B
- 2704 W Cortland St Unit 3
- 1712 N Washtenaw Ave
- 1712 N Washtenaw Ave Unit 1F
- 1712 N Washtenaw Ave Unit 2B
- 1712 N Washtenaw Ave Unit 1B
- 1712 N Washtenaw Ave Unit 2F
- 1712 N Washtenaw Ave Unit 3B
- 1712 N Washtenaw Ave Unit G
- 1712 N Washtenaw Ave Unit 3R
- 1712 N Washtenaw Ave Unit 2R
- 1712 N Washtenaw Ave Unit 1R
- 1714 N Washtenaw Ave
- 1714 N Washtenaw Ave Unit 2
- 1706 N Washtenaw Ave
- 1716 N Washtenaw Ave
- 1702 N Washtenaw Ave
- 1702 N Washtenaw Ave
- 1702 N Washtenaw Ave Unit 3
- 1702 N Washtenaw Ave Unit 2
- 1702 N Washtenaw Ave Unit 1
- 1718 N Washtenaw Ave