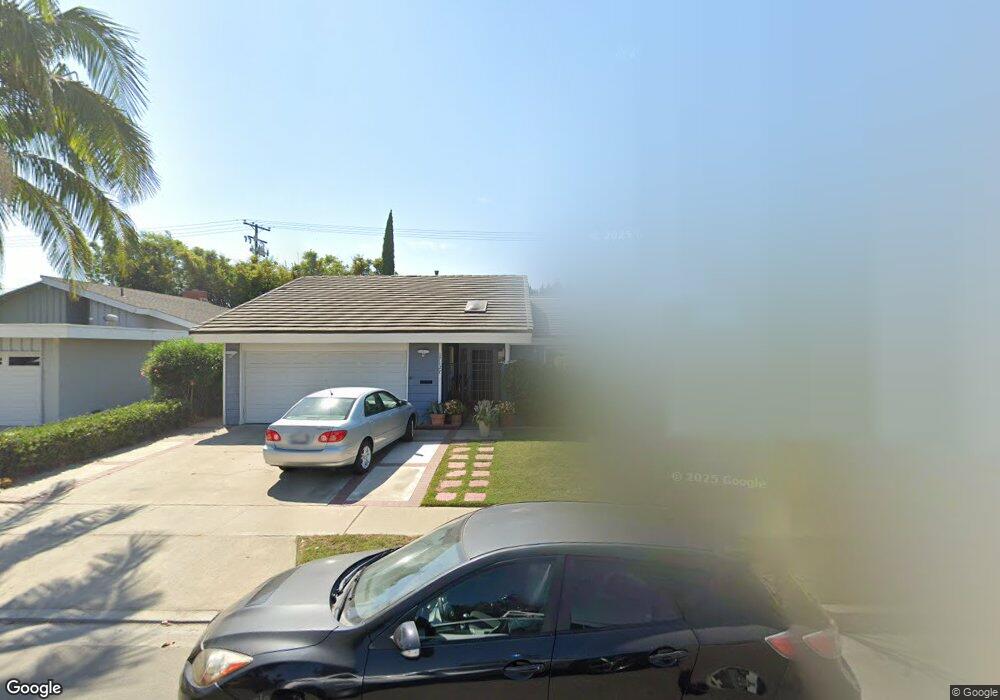
17127 San Alfredo Cir Fountain Valley, CA 92708
Estimated Value: $1,218,000 - $1,324,000
4
Beds
2
Baths
1,640
Sq Ft
$782/Sq Ft
Est. Value
About This Home
This home is located at 17127 San Alfredo Cir, Fountain Valley, CA 92708 and is currently estimated at $1,282,565, approximately $782 per square foot. 17127 San Alfredo Cir is a home located in Orange County with nearby schools including Cox (James H.) Elementary School, Masuda (Kazuo) Middle School, and Fountain Valley High School.
Ownership History
Date
Name
Owned For
Owner Type
Purchase Details
Closed on
Jan 26, 2016
Sold by
Nguyen Mai Thi
Bought by
Derienzo Mai T and The Mai T Derienzo Living Trust
Current Estimated Value
Purchase Details
Closed on
Apr 6, 2012
Sold by
Vo Nichole Thi
Bought by
Nguyen Mai Thi
Purchase Details
Closed on
Oct 11, 1995
Sold by
Ngo Thu Tam and Nguyen Mai Thi
Bought by
Nguyen Mai Thi and Vo Nicole Thi
Purchase Details
Closed on
May 13, 1995
Sold by
Ngo Thu Tam and Nguyen Mai Thi
Bought by
Nguyen Mai Thi and Vo Nicole Thi
Purchase Details
Closed on
Jul 20, 1994
Sold by
Ngo Thu Tam
Bought by
Ngo Thu Tam and Nguyen Mai Thi
Purchase Details
Closed on
Dec 7, 1993
Sold by
State Street Bank & Trust
Bought by
Ngo Thu Tam
Home Financials for this Owner
Home Financials are based on the most recent Mortgage that was taken out on this home.
Original Mortgage
$147,000
Interest Rate
7.16%
Create a Home Valuation Report for This Property
The Home Valuation Report is an in-depth analysis detailing your home's value as well as a comparison with similar homes in the area
Home Values in the Area
Average Home Value in this Area
Purchase History
| Date | Buyer | Sale Price | Title Company |
|---|---|---|---|
| Derienzo Mai T | -- | None Available | |
| Nguyen Mai Thi | -- | None Available | |
| Nguyen Mai Thi | -- | Chicago Title Co | |
| Nguyen Mai Thi | -- | -- | |
| Ngo Thu Tam | -- | -- | |
| Ngo Thu Tam | $210,000 | First American Title Ins Co |
Source: Public Records
Mortgage History
| Date | Status | Borrower | Loan Amount |
|---|---|---|---|
| Previous Owner | Ngo Thu Tam | $147,000 |
Source: Public Records
Tax History Compared to Growth
Tax History
| Year | Tax Paid | Tax Assessment Tax Assessment Total Assessment is a certain percentage of the fair market value that is determined by local assessors to be the total taxable value of land and additions on the property. | Land | Improvement |
|---|---|---|---|---|
| 2025 | $4,099 | $358,024 | $207,307 | $150,717 |
| 2024 | $4,099 | $351,004 | $203,242 | $147,762 |
| 2023 | $4,000 | $344,122 | $199,257 | $144,865 |
| 2022 | $3,938 | $337,375 | $195,350 | $142,025 |
| 2021 | $3,862 | $330,760 | $191,519 | $139,241 |
| 2020 | $3,838 | $327,369 | $189,555 | $137,814 |
| 2019 | $3,762 | $320,950 | $185,838 | $135,112 |
| 2018 | $3,811 | $325,862 | $182,194 | $143,668 |
| 2017 | $3,750 | $319,473 | $178,622 | $140,851 |
| 2016 | $3,592 | $313,209 | $175,119 | $138,090 |
| 2015 | $3,536 | $308,505 | $172,489 | $136,016 |
| 2014 | $3,465 | $302,462 | $169,110 | $133,352 |
Source: Public Records
Map
Nearby Homes
- 17071 Ward St
- 10452 Circulo de Juarez
- 10322 Avenida Cinco de Mayo
- 17077 Los Modelos St
- 17210 San Mateo St Unit 25
- 17288 San Lorenzo Cir
- 17401 Hood Ct
- 10430 La Cebra Ave
- 17333 Brookhurst St Unit D6
- 17333 Brookhurst St Unit B7
- 10900 La Flor Ave
- 11356 Stonecress Ave
- 17215 Buttonwood St
- 11325 Dewdrop Ave
- 16767 Madrone Cir
- 17168 Newhope St Unit 222
- 16379 Shadbush St
- 11620 Warner Ave Unit 624
- 17200 Newhope St Unit 109
- 17200 Newhope St Unit 217
- 17115 San Alfredo Cir
- 17139 San Alfredo Cir
- 10514 Perch Ave
- 10524 Perch Ave
- 10547 El Manzano Ave
- 10536 Perch Ave
- 10490 Calle Madero
- 17128 San Alfredo Cir
- 17111 Ward St
- 17116 San Alfredo Cir
- 10514 El Manzano Ave
- 10526 El Manzano Ave
- 10561 El Manzano Ave
- 10544 Perch Ave
- 10538 El Manzano Ave
- 10456 Calle Madero
- 10451 Calle Madero
- 10552 El Manzano Ave
- 17081 Ward St
- 10575 El Manzano Ave