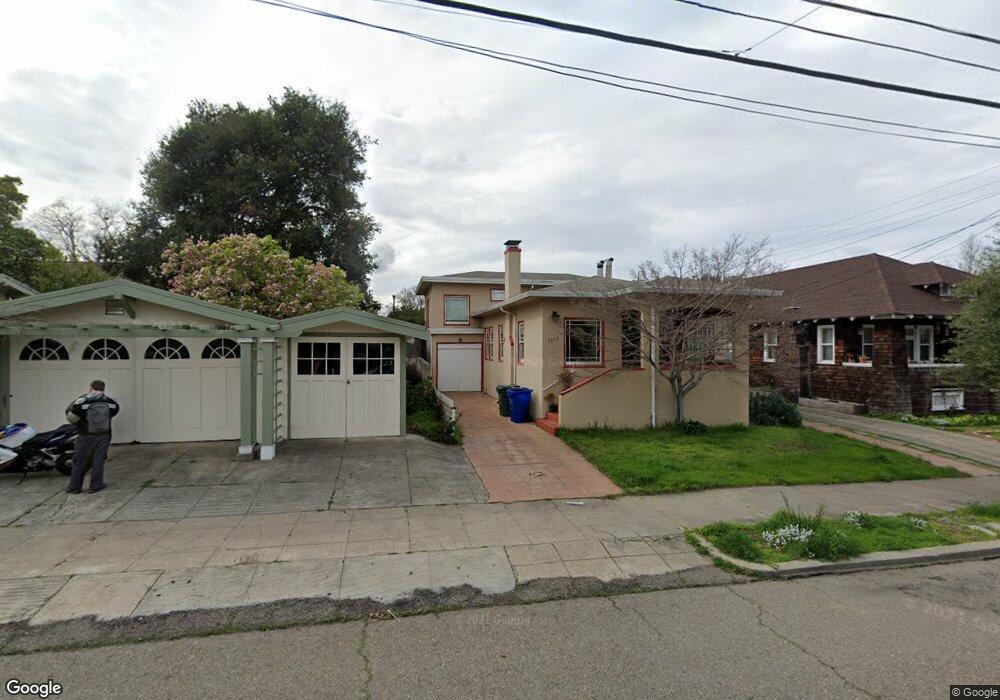
1713 9th St Alameda, CA 94501
West Alameda NeighborhoodEstimated Value: $1,669,000 - $1,718,000
4
Beds
2
Baths
2,346
Sq Ft
$721/Sq Ft
Est. Value
About This Home
This home is located at 1713 9th St, Alameda, CA 94501 and is currently estimated at $1,691,034, approximately $720 per square foot. 1713 9th St is a home located in Alameda County with nearby schools including Maya Lin School, Encinal Junior/Senior High, and Will C. Wood Middle School.
Ownership History
Date
Name
Owned For
Owner Type
Purchase Details
Closed on
Apr 10, 2015
Sold by
Perkins Kristy and Holloway Kendra
Bought by
Jeschke Rebecca
Current Estimated Value
Home Financials for this Owner
Home Financials are based on the most recent Mortgage that was taken out on this home.
Original Mortgage
$150,000
Outstanding Balance
$115,431
Interest Rate
3.73%
Mortgage Type
Commercial
Estimated Equity
$1,575,603
Purchase Details
Closed on
Jun 11, 2009
Sold by
Lee Cece and Salomon Gregg Darren
Bought by
Perkins Kristy and Holloway Kendra
Home Financials for this Owner
Home Financials are based on the most recent Mortgage that was taken out on this home.
Original Mortgage
$527,200
Interest Rate
4.82%
Mortgage Type
Commercial
Purchase Details
Closed on
Sep 19, 2006
Sold by
Kayo Charlene and Estate Of Idella E Mcmanus
Bought by
Cece Salomon Gregg Darren and Cece Lee
Home Financials for this Owner
Home Financials are based on the most recent Mortgage that was taken out on this home.
Original Mortgage
$610,000
Interest Rate
6.53%
Mortgage Type
Commercial
Purchase Details
Closed on
Sep 10, 2003
Sold by
Mcmanus Idella E
Bought by
Mcmanus Idella E and Mcmanus Sheila
Create a Home Valuation Report for This Property
The Home Valuation Report is an in-depth analysis detailing your home's value as well as a comparison with similar homes in the area
Home Values in the Area
Average Home Value in this Area
Purchase History
| Date | Buyer | Sale Price | Title Company |
|---|---|---|---|
| Jeschke Rebecca | $1,025,000 | Placer Title Company | |
| Perkins Kristy | $659,000 | Placer Title Company | |
| Cece Salomon Gregg Darren | $840,000 | First American Title Co | |
| Mcmanus Idella E | -- | -- |
Source: Public Records
Mortgage History
| Date | Status | Borrower | Loan Amount |
|---|---|---|---|
| Open | Jeschke Rebecca | $150,000 | |
| Open | Jeschke Rebecca | $555,000 | |
| Previous Owner | Perkins Kristy | $527,200 | |
| Previous Owner | Cece Salomon Gregg Darren | $610,000 |
Source: Public Records
Tax History
| Year | Tax Paid | Tax Assessment Tax Assessment Total Assessment is a certain percentage of the fair market value that is determined by local assessors to be the total taxable value of land and additions on the property. | Land | Improvement |
|---|---|---|---|---|
| 2025 | $17,644 | $1,224,854 | $369,556 | $862,298 |
| 2024 | $17,644 | $1,200,705 | $362,311 | $845,394 |
| 2023 | $16,959 | $1,184,028 | $355,208 | $828,820 |
| 2022 | $16,571 | $1,153,811 | $348,243 | $812,568 |
| 2021 | $16,155 | $1,131,057 | $341,417 | $796,640 |
| 2020 | $15,952 | $1,126,392 | $337,917 | $788,475 |
| 2019 | $15,179 | $1,104,314 | $331,294 | $773,020 |
| 2018 | $14,789 | $1,082,665 | $324,799 | $757,866 |
| 2017 | $14,095 | $1,061,438 | $318,431 | $743,007 |
| 2016 | $14,119 | $1,040,630 | $312,189 | $728,441 |
| 2015 | $10,325 | $706,091 | $211,827 | $494,264 |
| 2014 | $9,994 | $692,265 | $207,679 | $484,586 |
Source: Public Records
Map
Nearby Homes
- 1512 Mozart St
- 1523 Verdi St
- 1000 Central Ave
- 1217 Lincoln Ave
- 9 Regulus Ct
- 2180 Barnes Wharf Ln
- 2058 Barnes Wharf Ln
- 3009 Triumph Dr
- 1606 Morton St
- 1305 Webster St Unit C202
- 1305 Webster St Unit C102
- 1 Avocet Ct
- 1333 Webster St Unit A107
- 1327 Webster St Unit B101
- 1321 Webster St Unit D119
- 1321 Webster St Unit D116
- 1203 Benton St
- 1500 Alameda Ave Unit G
- 1401 Cottage St Unit D
- 548 Queens Rd
Your Personal Tour Guide
Ask me questions while you tour the home.