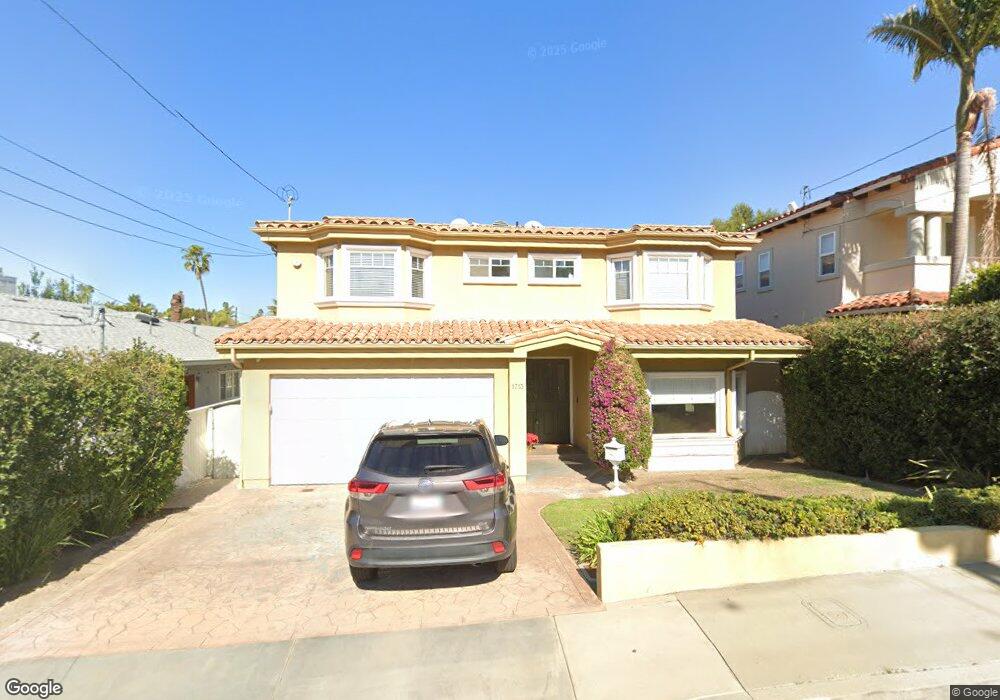
1713 Curtis Ave Manhattan Beach, CA 90266
Estimated Value: $3,025,538 - $3,739,000
6
Beds
5
Baths
3,500
Sq Ft
$968/Sq Ft
Est. Value
About This Home
This home is located at 1713 Curtis Ave, Manhattan Beach, CA 90266 and is currently estimated at $3,389,635, approximately $968 per square foot. 1713 Curtis Ave is a home located in Los Angeles County with nearby schools including Aurelia Pennekamp Elementary School, Manhattan Beach Middle School, and Mira Costa High School.
Ownership History
Date
Name
Owned For
Owner Type
Purchase Details
Closed on
Oct 6, 2018
Sold by
Daegele John F and Daegele Diane S
Bought by
Daegele John F and Daegele Diane S
Current Estimated Value
Purchase Details
Closed on
Oct 21, 1997
Sold by
Tilley William
Bought by
Daegele John F and Daegele Diane S
Home Financials for this Owner
Home Financials are based on the most recent Mortgage that was taken out on this home.
Original Mortgage
$500,000
Outstanding Balance
$78,924
Interest Rate
7.25%
Estimated Equity
$3,310,711
Purchase Details
Closed on
Nov 8, 1996
Sold by
Seals Earl K
Bought by
Tilley William
Home Financials for this Owner
Home Financials are based on the most recent Mortgage that was taken out on this home.
Original Mortgage
$45,500
Interest Rate
7.88%
Purchase Details
Closed on
Nov 6, 1996
Sold by
Tilley Jinx
Bought by
Tilley William
Home Financials for this Owner
Home Financials are based on the most recent Mortgage that was taken out on this home.
Original Mortgage
$45,500
Interest Rate
7.88%
Purchase Details
Closed on
Jun 24, 1996
Sold by
Seals Shirley
Bought by
Seals Earl K
Create a Home Valuation Report for This Property
The Home Valuation Report is an in-depth analysis detailing your home's value as well as a comparison with similar homes in the area
Home Values in the Area
Average Home Value in this Area
Purchase History
| Date | Buyer | Sale Price | Title Company |
|---|---|---|---|
| Daegele John F | -- | None Available | |
| Daegele John F | -- | None Available | |
| Daegele John F | -- | Commonwealth Land Title Co | |
| Tilley William | $225,000 | Commonwealth Land Title Co | |
| Tilley William | -- | -- | |
| Seals Earl K | -- | -- |
Source: Public Records
Mortgage History
| Date | Status | Borrower | Loan Amount |
|---|---|---|---|
| Open | Daegele John F | $500,000 | |
| Previous Owner | Tilley William | $45,500 |
Source: Public Records
Tax History
| Year | Tax Paid | Tax Assessment Tax Assessment Total Assessment is a certain percentage of the fair market value that is determined by local assessors to be the total taxable value of land and additions on the property. | Land | Improvement |
|---|---|---|---|---|
| 2025 | $13,317 | $1,141,664 | $540,973 | $600,691 |
| 2024 | $13,317 | $1,119,279 | $530,366 | $588,913 |
| 2023 | $12,860 | $1,097,333 | $519,967 | $577,366 |
| 2022 | $12,642 | $1,075,818 | $509,772 | $566,046 |
| 2021 | $12,443 | $1,054,725 | $499,777 | $554,948 |
| 2019 | $12,115 | $1,023,443 | $484,954 | $538,489 |
| 2018 | $11,809 | $1,003,377 | $475,446 | $527,931 |
| 2016 | $10,856 | $964,417 | $456,985 | $507,432 |
| 2015 | $10,633 | $949,931 | $450,121 | $499,810 |
| 2014 | $10,490 | $931,324 | $441,304 | $490,020 |
Source: Public Records
Map
Nearby Homes
- 308 S Redondo Ave
- 1769 Gates Ave
- 1612 Gates Ave
- 1726 Voorhees Ave
- 1652 Voorhees Ave
- 1736 Voorhees Ave
- 1647 Ruhland Ave
- 113 S Herrin Ave
- 1712 Ruhland Ave
- 1659 3rd St
- 213 Aviation Place
- 1500 2nd St
- 311 Aviation Place
- 615 Aviation Way
- 1806 6th St
- 1852 6th St
- 1619 Artesia Blvd Unit A
- 2005 Robinson St Unit B
- 2012 Robinson St
- 1623 8th St
- 1707 Curtis Ave
- 1717 Curtis Ave
- 216 S Redondo Ave
- 1701 Curtis Ave
- 1721 Curtis Ave
- 1706 Curtis Ave
- 1727 Curtis Ave
- 1712 Curtis Ave
- 1700 Curtis Ave
- 1712 Gates Ave
- 1716 Gates Ave
- 1706 Gates Ave
- 1657 Curtis Ave
- 1720 Curtis Ave
- 217 S Redondo Ave
- 1731 Curtis Ave
- 1720 Gates Ave
- 1700 Gates Ave
- 1726 Curtis Ave
- 1726 Gates Ave
Your Personal Tour Guide
Ask me questions while you tour the home.