Estimated Value: $212,354 - $280,000
3
Beds
2
Baths
1,848
Sq Ft
$131/Sq Ft
Est. Value
About This Home
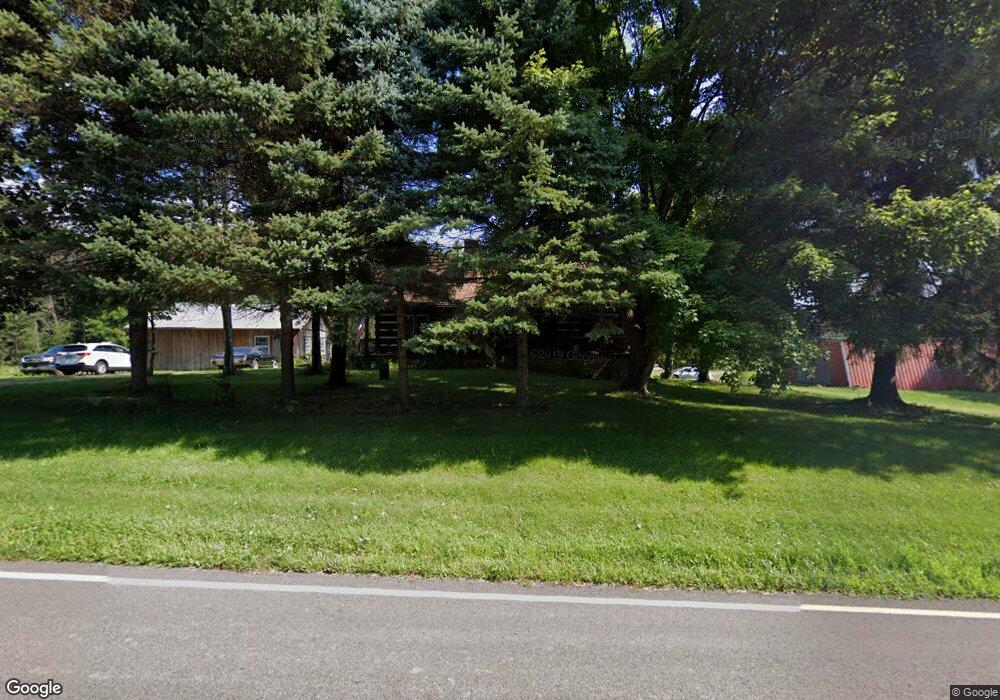
This home is located at 1713 E Hanley Rd, Lucas, OH 44843 and is currently estimated at $241,339, approximately $130 per square foot. 1713 E Hanley Rd is a home located in Richland County with nearby schools including Lucas Elementary School, Lucas Heritage Middle School, and Lucas High School.
Ownership History
Date
Name
Owned For
Owner Type
Purchase Details
Closed on
Dec 9, 2011
Sold by
Johnson Charity L
Bought by
Wilson Melissa D and Wilson Bradley E
Current Estimated Value
Home Financials for this Owner
Home Financials are based on the most recent Mortgage that was taken out on this home.
Original Mortgage
$46,783
Outstanding Balance
$31,468
Interest Rate
4.12%
Mortgage Type
FHA
Estimated Equity
$209,871
Purchase Details
Closed on
Jun 21, 2011
Sold by
Homesales Inc
Bought by
Johnson Charity L
Purchase Details
Closed on
Jan 26, 2011
Sold by
Neutzling William D and Neutzling Jeanette G
Bought by
Jpmorgan Chase Bank N A
Purchase Details
Closed on
Nov 14, 1997
Sold by
Bowles Rebecca S
Bought by
Neutzling William D and Neutzling Jeanette G
Home Financials for this Owner
Home Financials are based on the most recent Mortgage that was taken out on this home.
Original Mortgage
$88,000
Interest Rate
7.43%
Mortgage Type
New Conventional
Purchase Details
Closed on
Jul 23, 1993
Sold by
Mcfarland Tommy A
Bought by
Bowles Rebecca S
Create a Home Valuation Report for This Property
The Home Valuation Report is an in-depth analysis detailing your home's value as well as a comparison with similar homes in the area
Purchase History
| Date | Buyer | Sale Price | Title Company |
|---|---|---|---|
| Wilson Melissa D | $48,000 | Southern Title | |
| Johnson Charity L | $37,500 | Southern Title | |
| Homesales Inc | -- | Southern Title | |
| Jpmorgan Chase Bank N A | -- | Thoroughbred Title Agency In | |
| Neutzling William D | $110,000 | -- | |
| Bowles Rebecca S | $75,000 | -- |
Source: Public Records
Mortgage History
| Date | Status | Borrower | Loan Amount |
|---|---|---|---|
| Open | Wilson Melissa D | $46,783 | |
| Previous Owner | Neutzling William D | $88,000 |
Source: Public Records
Tax History
| Year | Tax Paid | Tax Assessment Tax Assessment Total Assessment is a certain percentage of the fair market value that is determined by local assessors to be the total taxable value of land and additions on the property. | Land | Improvement |
|---|---|---|---|---|
| 2025 | $1,995 | $48,880 | $6,930 | $41,950 |
| 2024 | $1,995 | $48,880 | $6,930 | $41,950 |
| 2023 | $2,049 | $48,880 | $6,930 | $41,950 |
| 2022 | $1,817 | $38,730 | $6,200 | $32,530 |
| 2021 | $1,821 | $38,730 | $6,200 | $32,530 |
| 2020 | $1,851 | $38,730 | $6,200 | $32,530 |
| 2019 | $1,674 | $32,920 | $5,250 | $27,670 |
| 2018 | $1,722 | $32,920 | $5,250 | $27,670 |
| 2017 | $1,305 | $32,920 | $5,250 | $27,670 |
| 2016 | $875 | $16,810 | $4,730 | $12,080 |
| 2015 | $875 | $16,810 | $4,730 | $12,080 |
| 2014 | $880 | $16,810 | $4,730 | $12,080 |
| 2012 | $433 | $16,810 | $4,730 | $12,080 |
Source: Public Records
Map
Nearby Homes
- 2130 State Route 39
- 2804 Rd
- 1 E Main St
- 28 N Union St
- 744 E Hanley Rd
- 2778 Lucas Perrysville Rd
- 3405 Hastings Newville Rd
- 1715 Mansfield Lucas Rd
- 400 Garver Rd
- 2011 Ohio 39
- 0 State Route 39 & I-71 Northeast Quadrant
- 0 State Route 39 & I-71 Southeast Quadrant
- 3362 Possum Run Rd
- 50 Lilac Ct E
- 794 Mansfield Washington Rd
- 625 Mansfield Lucas Rd
- 0 Mount Zion Rd Unit 226009674
- 0 Mount Zion Rd Unit 9072801
- 213 Brushwood Dr
- 1200 S Main St
Your Personal Tour Guide
Ask me questions while you tour the home.