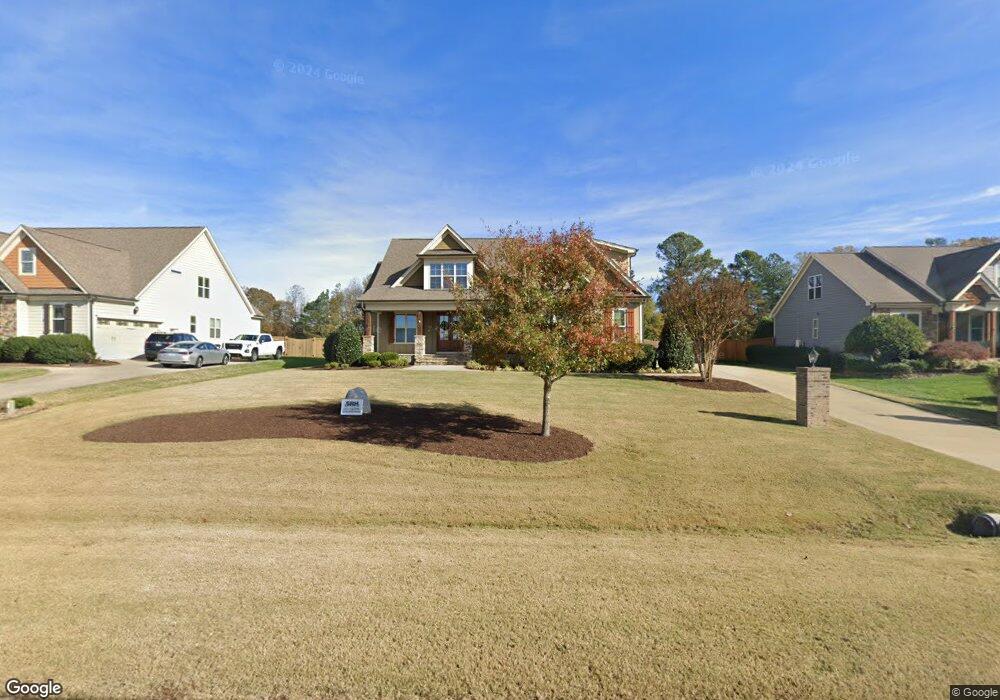
1713 Font Hills Ln Unit 12 Knightdale, NC 27545
Shotwell NeighborhoodEstimated Value: $587,000 - $713,447
--
Bed
1
Bath
3,004
Sq Ft
$223/Sq Ft
Est. Value
About This Home
This home is located at 1713 Font Hills Ln Unit 12, Knightdale, NC 27545 and is currently estimated at $668,862, approximately $222 per square foot. 1713 Font Hills Ln Unit 12 is a home located in Wake County with nearby schools including Lake Myra Elementary, Wendell Middle School, and East Wake High School.
Ownership History
Date
Name
Owned For
Owner Type
Purchase Details
Closed on
Feb 22, 2019
Sold by
Pullium Christopher A and Pullium Susan W
Bought by
Chesney Wilbur Jovonnie and Chesney Lynne Darselle
Current Estimated Value
Home Financials for this Owner
Home Financials are based on the most recent Mortgage that was taken out on this home.
Original Mortgage
$420,000
Outstanding Balance
$368,502
Interest Rate
4.4%
Mortgage Type
VA
Estimated Equity
$300,360
Purchase Details
Closed on
Jun 20, 2013
Sold by
Smith Crossing Llc
Bought by
Satterwhite Construction Inc
Home Financials for this Owner
Home Financials are based on the most recent Mortgage that was taken out on this home.
Original Mortgage
$284,250
Interest Rate
3.53%
Mortgage Type
Construction
Purchase Details
Closed on
Mar 19, 2009
Sold by
Foxborough Development Inc
Bought by
Smith Crossing Llc
Create a Home Valuation Report for This Property
The Home Valuation Report is an in-depth analysis detailing your home's value as well as a comparison with similar homes in the area
Home Values in the Area
Average Home Value in this Area
Purchase History
| Date | Buyer | Sale Price | Title Company |
|---|---|---|---|
| Chesney Wilbur Jovonnie | $420,000 | None Available | |
| Satterwhite Construction Inc | $134,000 | None Available | |
| Smith Crossing Llc | -- | None Available |
Source: Public Records
Mortgage History
| Date | Status | Borrower | Loan Amount |
|---|---|---|---|
| Open | Chesney Wilbur Jovonnie | $420,000 | |
| Previous Owner | Satterwhite Construction Inc | $284,250 |
Source: Public Records
Tax History Compared to Growth
Tax History
| Year | Tax Paid | Tax Assessment Tax Assessment Total Assessment is a certain percentage of the fair market value that is determined by local assessors to be the total taxable value of land and additions on the property. | Land | Improvement |
|---|---|---|---|---|
| 2025 | $4,361 | $678,767 | $95,000 | $583,767 |
| 2024 | $4,235 | $678,767 | $95,000 | $583,767 |
| 2023 | $3,471 | $442,656 | $58,000 | $384,656 |
| 2022 | $3,217 | $442,656 | $58,000 | $384,656 |
| 2021 | $3,014 | $426,102 | $58,000 | $368,102 |
| 2020 | $2,964 | $426,102 | $58,000 | $368,102 |
| 2019 | $2,931 | $356,479 | $58,000 | $298,479 |
| 2018 | $2,695 | $356,479 | $58,000 | $298,479 |
| 2017 | $2,555 | $356,479 | $58,000 | $298,479 |
| 2016 | $2,503 | $356,479 | $58,000 | $298,479 |
| 2015 | $2,889 | $413,163 | $85,000 | $328,163 |
| 2014 | $2,739 | $413,163 | $85,000 | $328,163 |
Source: Public Records
Map
Nearby Homes
- 1612 Font Hills Ln
- 8323 Poole Rd
- 1317 Sweet Charm Ln
- 1305 Shakentown St
- 5105 Baywood Forest Dr
- 5404 Rutledgeville Ln
- 1017 Harvest Mill Ct
- 5437 Rutledgeville Ln
- 5104 Parkerwood Dr
- 1240 Sweetgrass St
- 5200 Limewood St
- 5209 Limewood St
- 0 Old Ferrell Rd
- 2517 Oakes Plantation Dr
- 1417 Stone Wealth Dr
- 1128 Rutledge Landing Dr
- 5212 Sapphire Springs Dr
- 1157 Rutledge Landing Dr
- 5329 Cottage Bluff Ln
- 920 Knotts Hill Place
- 1713 Font Hills Ln
- 1709 Font Hills Ln
- 1717 Font Hills Ln
- 1705 Font Hills Ln
- 1721 Font Hills Ln
- 8432 Greythorne Place
- 8428 Greythorne Place
- 8428 Greythorne Place Unit 16
- 8420 Greythorne Place
- 8412 Greythorne Place
- 8412 Greythorne Place Unit 3
- 1729 Font Hills Ln
- 1700 Font Hills Ln
- 8405 Greythorne Place
- 8405 Greythorne Place Unit 49
- 8408 Greythorne Place
- 1733 Font Hills Ln
- 1733 Font Hills Ln Unit 7
- 1620 Hoppy Hill Dr
- 8425 Greythorne Place Unit 20