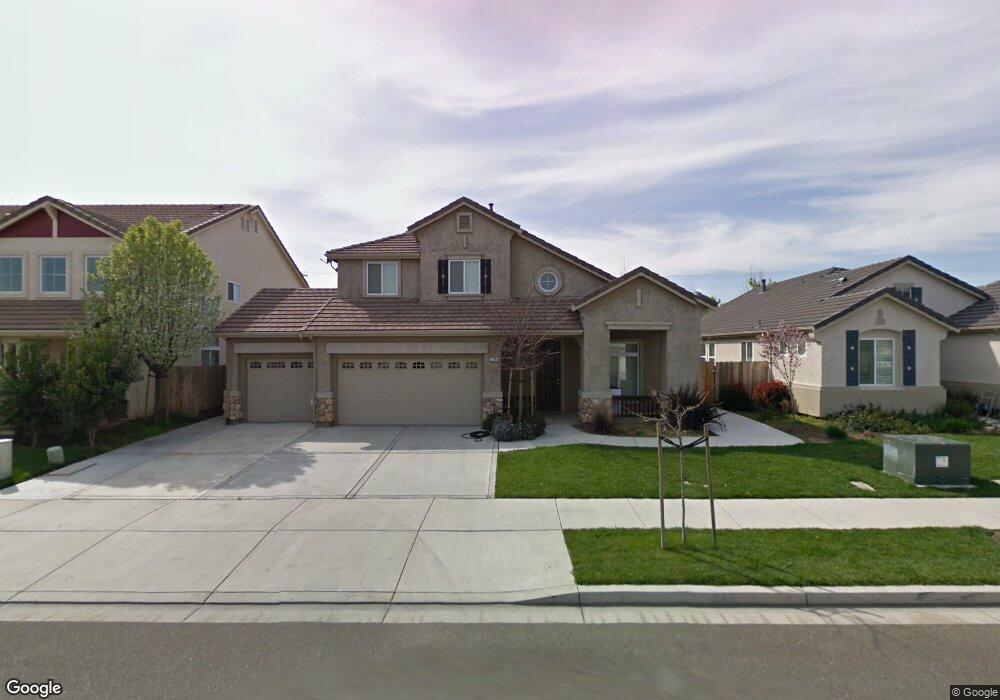
1713 Ginkgo Ave Ceres, CA 95307
Mayfield NeighborhoodEstimated Value: $511,000 - $570,000
4
Beds
3
Baths
2,143
Sq Ft
$253/Sq Ft
Est. Value
About This Home
This home is located at 1713 Ginkgo Ave, Ceres, CA 95307 and is currently estimated at $541,852, approximately $252 per square foot. 1713 Ginkgo Ave is a home located in Stanislaus County with nearby schools including Samuel Vaughn Elementary School, Cesar Chavez Junior High School, and Ceres High School.
Ownership History
Date
Name
Owned For
Owner Type
Purchase Details
Closed on
Jul 28, 2010
Sold by
Wells Fargo Bank Na
Bought by
Parbol Laura
Current Estimated Value
Home Financials for this Owner
Home Financials are based on the most recent Mortgage that was taken out on this home.
Original Mortgage
$146,400
Outstanding Balance
$97,236
Interest Rate
4.71%
Mortgage Type
New Conventional
Estimated Equity
$444,616
Purchase Details
Closed on
May 27, 2010
Sold by
Rubio Onofre
Bought by
Wells Fargo Bank Na
Purchase Details
Closed on
Dec 19, 2005
Sold by
Matthews Patrick H
Bought by
Rubin Onofre
Home Financials for this Owner
Home Financials are based on the most recent Mortgage that was taken out on this home.
Original Mortgage
$369,760
Interest Rate
6.36%
Mortgage Type
Stand Alone First
Purchase Details
Closed on
May 6, 2004
Sold by
Ceres Pinehurst Lp
Bought by
Matthews Patrick H and The P H M Revocable Trust
Create a Home Valuation Report for This Property
The Home Valuation Report is an in-depth analysis detailing your home's value as well as a comparison with similar homes in the area
Home Values in the Area
Average Home Value in this Area
Purchase History
| Date | Buyer | Sale Price | Title Company |
|---|---|---|---|
| Parbol Laura | $183,000 | Old Republic Title Company | |
| Wells Fargo Bank Na | $163,402 | Accommodation | |
| Rubin Onofre | -- | Alliance Title Company | |
| Rubio Onofre | -- | Alliance Title Company | |
| Matthews Patrick H | -- | Alliance Title Company |
Source: Public Records
Mortgage History
| Date | Status | Borrower | Loan Amount |
|---|---|---|---|
| Open | Parbol Laura | $146,400 | |
| Previous Owner | Rubio Onofre | $369,760 |
Source: Public Records
Tax History
| Year | Tax Paid | Tax Assessment Tax Assessment Total Assessment is a certain percentage of the fair market value that is determined by local assessors to be the total taxable value of land and additions on the property. | Land | Improvement |
|---|---|---|---|---|
| 2025 | $3,318 | $242,138 | $76,865 | $165,273 |
| 2024 | $3,128 | $237,391 | $75,358 | $162,033 |
| 2023 | $3,039 | $232,737 | $73,881 | $158,856 |
| 2022 | $2,999 | $228,175 | $72,433 | $155,742 |
| 2021 | $2,942 | $223,702 | $71,013 | $152,689 |
| 2020 | $2,861 | $221,409 | $70,285 | $151,124 |
| 2019 | $2,843 | $217,068 | $68,907 | $148,161 |
| 2018 | $2,779 | $212,812 | $67,556 | $145,256 |
| 2017 | $2,749 | $208,640 | $66,232 | $142,408 |
| 2016 | $2,690 | $204,550 | $64,934 | $139,616 |
| 2015 | $2,579 | $195,076 | $63,959 | $131,117 |
| 2014 | $2,525 | $191,256 | $62,707 | $128,549 |
Source: Public Records
Map
Nearby Homes
- 1536 Vandalay Dr
- 1813 Lupin Ln
- 3786 Waynesboro Dr
- 1617 Charlottesville Ln
- 3401 Matterhorn Way
- 3009 Glen Grove Ct
- 3613 Southern Oak Dr
- 3432 Vera Way
- 2841 Fowler Rd Unit 33
- 2841 Fowler Rd Unit 89
- 3408 Puma Way
- 2845 E Hatch Rd Unit 86
- 2845 E Hatch Rd Unit 84
- 2845 E Hatch Rd Unit 68
- 2741 Rosewood Ave
- 2644 Parkway
- 2816 Canyon Dr
- 2808 Canyon Dr
- 2712 River Valley Cir
- 2605 Glasgow Dr
- 1717 Ginkgo Ave
- 1709 Ginkgo Ave
- 1717 Ginkgo Ave
- 1705 Ginkgo Ave
- 1721 Ginkgo Ave
- 1713 Boothe Rd
- 1721 Boothe Rd
- 1712 Ginkgo Ave
- 1709 Boothe Rd
- 1708 Ginkgo Ave
- 1716 Ginkgo Ave
- 1725 Boothe Rd
- 1701 Ginkgo Ave
- 1705 Boothe Rd
- 1704 Ginkgo Ave
- 1729 Boothe Rd
- 1720 Ginkgo Ave
- 1701 Boothe Rd
- 1716 Norfolk Way
- 1712 Norfolk Way
Your Personal Tour Guide
Ask me questions while you tour the home.