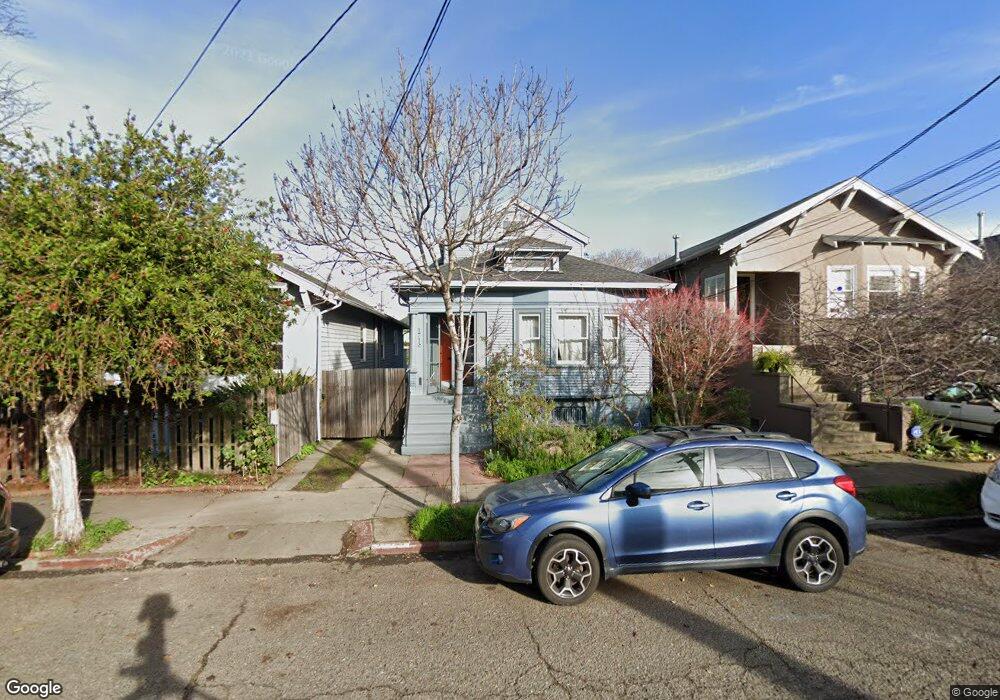
1713 Oregon St Berkeley, CA 94703
South Berkeley NeighborhoodEstimated Value: $1,261,000 - $1,679,032
3
Beds
3
Baths
2,050
Sq Ft
$679/Sq Ft
Est. Value
About This Home
This home is located at 1713 Oregon St, Berkeley, CA 94703 and is currently estimated at $1,391,758, approximately $678 per square foot. 1713 Oregon St is a home located in Alameda County with nearby schools including Malcolm X Elementary School, Emerson Elementary School, and John Muir Elementary School.
Ownership History
Date
Name
Owned For
Owner Type
Purchase Details
Closed on
Nov 13, 2023
Sold by
Rappaport Julie
Bought by
Julie Rappaport Living Trust and Rappaport
Current Estimated Value
Purchase Details
Closed on
May 6, 2002
Sold by
Dopp Wilkerson Jr Emery and Dopp Wilkerson Greta L
Bought by
Rappaport Julie
Home Financials for this Owner
Home Financials are based on the most recent Mortgage that was taken out on this home.
Original Mortgage
$250,000
Interest Rate
6.12%
Create a Home Valuation Report for This Property
The Home Valuation Report is an in-depth analysis detailing your home's value as well as a comparison with similar homes in the area
Home Values in the Area
Average Home Value in this Area
Purchase History
| Date | Buyer | Sale Price | Title Company |
|---|---|---|---|
| Julie Rappaport Living Trust | -- | None Listed On Document | |
| Rappaport Julie | $495,000 | Placer Title Company |
Source: Public Records
Mortgage History
| Date | Status | Borrower | Loan Amount |
|---|---|---|---|
| Previous Owner | Rappaport Julie | $250,000 |
Source: Public Records
Tax History Compared to Growth
Tax History
| Year | Tax Paid | Tax Assessment Tax Assessment Total Assessment is a certain percentage of the fair market value that is determined by local assessors to be the total taxable value of land and additions on the property. | Land | Improvement |
|---|---|---|---|---|
| 2025 | $14,735 | $929,816 | $219,364 | $717,452 |
| 2024 | $14,735 | $911,449 | $215,063 | $703,386 |
| 2023 | $14,425 | $900,444 | $210,847 | $689,597 |
| 2022 | $14,154 | $875,789 | $206,713 | $676,076 |
| 2021 | $14,181 | $858,483 | $202,660 | $662,823 |
| 2020 | $13,379 | $856,610 | $200,583 | $656,027 |
| 2019 | $12,127 | $725,503 | $196,651 | $528,852 |
| 2018 | $9,598 | $642,653 | $192,796 | $449,857 |
| 2017 | $9,253 | $630,055 | $189,016 | $441,039 |
| 2016 | $8,958 | $617,704 | $185,311 | $432,393 |
| 2015 | $8,840 | $608,428 | $182,528 | $425,900 |
| 2014 | $8,779 | $596,514 | $178,954 | $417,560 |
Source: Public Records
Map
Nearby Homes
- 2829 California St
- 1540 Stuart St
- 1606 Derby St
- 2701 Grant St
- 2926 Ellis St
- 1711 Carleton St
- 1726 Parker St Unit 2
- 1726 Parker St Unit 1
- 1612 Parker St
- 2790 Sacramento St
- 2782 Sacramento St
- 2774 Sacramento St
- 2750 Sacramento St
- 1819 Carleton St
- 2758 Sacramento St
- 1450 Ward St
- 1538 Ashby Ave
- 2533 Grant St
- 3033 Ellis St Unit B
- 1525 Tyler St