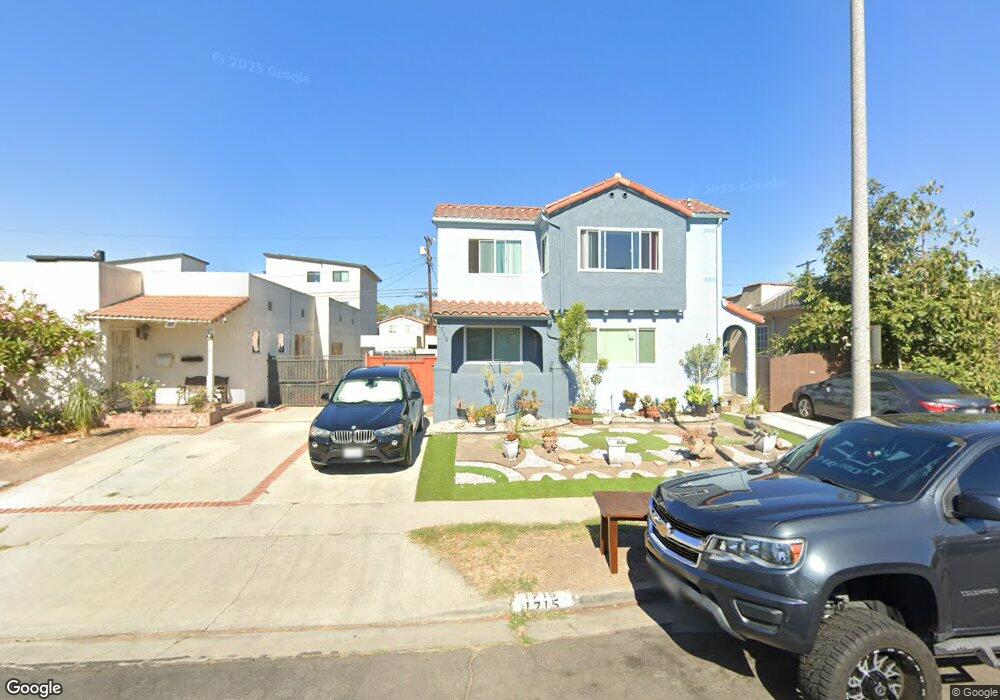
1713 S Sycamore Ave Los Angeles, CA 90019
Mid-City NeighborhoodEstimated Value: $1,167,359 - $1,410,000
4
Beds
3
Baths
2,516
Sq Ft
$514/Sq Ft
Est. Value
About This Home
This home is located at 1713 S Sycamore Ave, Los Angeles, CA 90019 and is currently estimated at $1,292,340, approximately $513 per square foot. 1713 S Sycamore Ave is a home located in Los Angeles County with nearby schools including Saturn Street Elementary School, Los Angeles Senior High School, and Stella Elementary Charter Academy.
Ownership History
Date
Name
Owned For
Owner Type
Purchase Details
Closed on
Apr 22, 2025
Sold by
Andrene Scott Divine Source Living Legac and Scott Andrene
Bought by
Scott Andrene
Current Estimated Value
Home Financials for this Owner
Home Financials are based on the most recent Mortgage that was taken out on this home.
Original Mortgage
$420,000
Outstanding Balance
$418,143
Interest Rate
6.67%
Mortgage Type
New Conventional
Estimated Equity
$874,197
Purchase Details
Closed on
May 10, 2024
Sold by
Scott Andrene
Bought by
Andrene Scott Divine Source Living Legacy Tru and Scott
Purchase Details
Closed on
Aug 29, 2007
Sold by
Scott Andrene and Ri Eugene Scott Revocable Livi
Bought by
Scott Andrene
Purchase Details
Closed on
Mar 11, 2007
Sold by
Scott Rufus Ira Eugene
Bought by
R I Eugene Scott Revocable Living Trust
Create a Home Valuation Report for This Property
The Home Valuation Report is an in-depth analysis detailing your home's value as well as a comparison with similar homes in the area
Home Values in the Area
Average Home Value in this Area
Purchase History
| Date | Buyer | Sale Price | Title Company |
|---|---|---|---|
| Scott Andrene | -- | Priority Title | |
| Andrene Scott Divine Source Living Legacy Tru | -- | None Listed On Document | |
| Scott Andrene | -- | None Available | |
| R I Eugene Scott Revocable Living Trust | -- | None Available |
Source: Public Records
Mortgage History
| Date | Status | Borrower | Loan Amount |
|---|---|---|---|
| Open | Scott Andrene | $420,000 |
Source: Public Records
Tax History Compared to Growth
Tax History
| Year | Tax Paid | Tax Assessment Tax Assessment Total Assessment is a certain percentage of the fair market value that is determined by local assessors to be the total taxable value of land and additions on the property. | Land | Improvement |
|---|---|---|---|---|
| 2025 | $1,122 | $61,220 | $25,949 | $35,271 |
| 2024 | $1,122 | $60,021 | $25,441 | $34,580 |
| 2023 | $1,112 | $58,845 | $24,943 | $33,902 |
| 2022 | $1,076 | $57,692 | $24,454 | $33,238 |
| 2021 | $1,046 | $56,562 | $23,975 | $32,587 |
| 2019 | $1,023 | $54,886 | $23,265 | $31,621 |
| 2018 | $913 | $53,810 | $22,809 | $31,001 |
| 2016 | $848 | $51,723 | $21,924 | $29,799 |
| 2015 | $839 | $50,947 | $21,595 | $29,352 |
| 2014 | $858 | $49,950 | $21,172 | $28,778 |
Source: Public Records
Map
Nearby Homes
- 1801 S Sycamore Ave
- 1623 S Sycamore Ave
- 5036 Pickford St
- 1820 Alsace Ave
- 5173 Pickford St
- 1502 S Redondo Blvd
- 1858 S Orange Dr
- 1861 S Redondo Blvd
- 1851 S Cloverdale Ave
- 1915 1917 S Orange Dr
- 1419 S Redondo Blvd
- 1867 S Cochran Ave
- 1807 Cochran Place
- 1801 S Longwood Ave
- 4935 W 20th St
- 5154 W 20th St
- 5047 W 21st St
- 1733 S Longwood Ave
- 1812 S Dunsmuir Ave
- 4835 Pickford St
- 1711 S Sycamore Ave
- 1721 S Sycamore Ave
- 1707 S Sycamore Ave
- 1725 S Sycamore Ave
- 5075 Pickford St
- 1703 S Sycamore Ave
- 5065 Pickford St
- 5077 Pickford St
- 1706 S Redondo Blvd
- 1700 S Redondo Blvd Unit 1/2
- 1700 S Redondo Blvd
- 1716 S Sycamore Ave
- 1633 S Sycamore Ave
- 1710 S Sycamore Ave
- 1718 S Sycamore Ave
- 5079 Pickford St
- 1624 S Redondo Blvd
- 1706 S Sycamore Ave
- 1724 S Sycamore Ave
- 1716 S Redondo Blvd