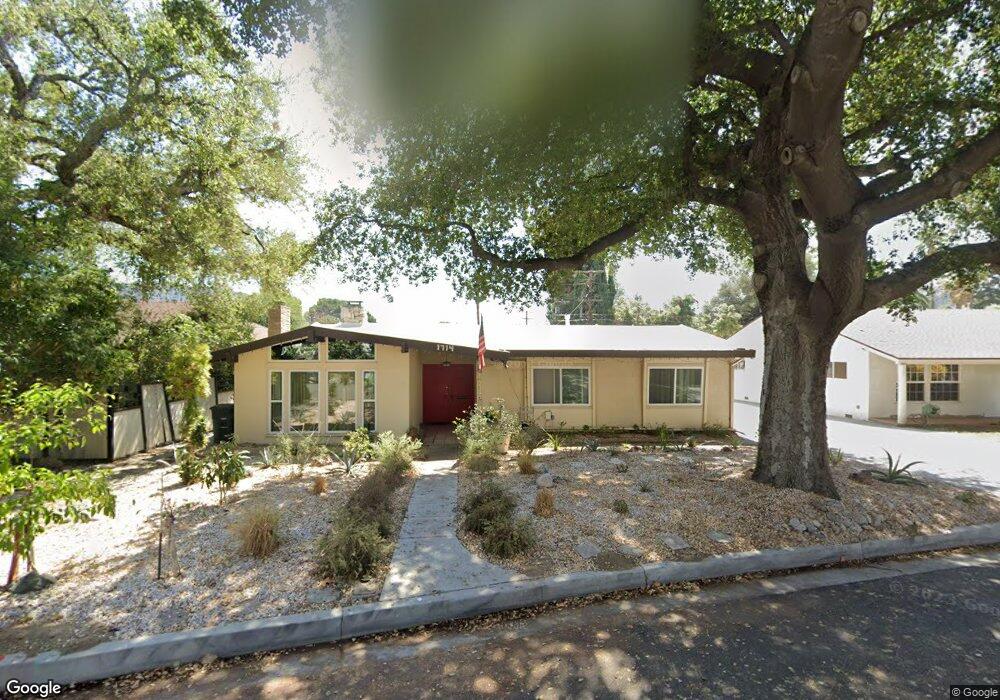
1714 Capistrano Cir Glendale, CA 91208
Verdugo Woodlands NeighborhoodEstimated Value: $1,370,000 - $1,569,000
3
Beds
2
Baths
1,811
Sq Ft
$818/Sq Ft
Est. Value
About This Home
This home is located at 1714 Capistrano Cir, Glendale, CA 91208 and is currently estimated at $1,481,383, approximately $817 per square foot. 1714 Capistrano Cir is a home located in Los Angeles County with nearby schools including Verdugo Woodlands Elementary School, Woodrow Wilson Middle School, and Glendale High School.
Ownership History
Date
Name
Owned For
Owner Type
Purchase Details
Closed on
Nov 8, 2012
Sold by
Bandarian Varooj
Bought by
Bandarian Varooj and Nazari Juliet
Current Estimated Value
Home Financials for this Owner
Home Financials are based on the most recent Mortgage that was taken out on this home.
Original Mortgage
$343,500
Outstanding Balance
$236,802
Interest Rate
3.34%
Mortgage Type
New Conventional
Estimated Equity
$1,244,581
Purchase Details
Closed on
Sep 11, 2011
Sold by
Bandarian Varooj
Bought by
Bandarian Varooj and Nazari Juliet
Purchase Details
Closed on
Nov 10, 2009
Sold by
Somerville Thomas C
Bought by
Bandarian Varooj and Nazari Juliet
Home Financials for this Owner
Home Financials are based on the most recent Mortgage that was taken out on this home.
Original Mortgage
$370,000
Interest Rate
5.01%
Mortgage Type
New Conventional
Purchase Details
Closed on
Jun 18, 1999
Sold by
Somerville Thomas C
Bought by
Somerville Thomas C and Somerville Virginia W
Create a Home Valuation Report for This Property
The Home Valuation Report is an in-depth analysis detailing your home's value as well as a comparison with similar homes in the area
Home Values in the Area
Average Home Value in this Area
Purchase History
| Date | Buyer | Sale Price | Title Company |
|---|---|---|---|
| Bandarian Varooj | -- | Lsi | |
| Bandarian Varooj | -- | None Available | |
| Bandarian Varooj | $730,000 | Equity Title Company | |
| Somerville Thomas C | -- | -- |
Source: Public Records
Mortgage History
| Date | Status | Borrower | Loan Amount |
|---|---|---|---|
| Open | Bandarian Varooj | $343,500 | |
| Closed | Bandarian Varooj | $370,000 |
Source: Public Records
Tax History
| Year | Tax Paid | Tax Assessment Tax Assessment Total Assessment is a certain percentage of the fair market value that is determined by local assessors to be the total taxable value of land and additions on the property. | Land | Improvement |
|---|---|---|---|---|
| 2025 | $10,248 | $942,286 | $607,713 | $334,573 |
| 2024 | $10,248 | $923,811 | $595,798 | $328,013 |
| 2023 | $10,015 | $905,698 | $584,116 | $321,582 |
| 2022 | $9,839 | $887,940 | $572,663 | $315,277 |
| 2021 | $9,668 | $870,531 | $561,435 | $309,096 |
| 2019 | $9,297 | $844,713 | $544,784 | $299,929 |
| 2018 | $9,093 | $828,151 | $534,102 | $294,049 |
| 2016 | $8,675 | $795,995 | $513,363 | $282,632 |
| 2015 | $8,496 | $784,039 | $505,652 | $278,387 |
| 2014 | $8,420 | $768,681 | $495,747 | $272,934 |
Source: Public Records
Map
Nearby Homes
- 1765 Fern Ln
- 1 Pasa Glen Dr
- 2460 Las Positas Rd
- 1823 Hillside Dr
- 182 Emburns Dr
- 192 Emburns Dr
- 2 Emburns Dr
- 1724 Sombra Dr
- 2420 Delisle Ct
- 2940 N Verdugo Rd Unit 214
- 0 Arvin Dr Unit SR26065904
- 0 Arvin Dr Unit SR26065915
- 2950 Oak Glen Rd
- 0 Vista Del Verde Dr Unit JT26048198
- 2 Vista Del Verde Dr
- 6 Vista Del Verde Dr
- 2 Pasa Glen Dr
- 3 Vista Del Verde Dr
- 4 Vista Del Verde Dr
- 1659 Puebla Dr
- 1720 Capistrano Cir
- 1708 Capistrano Cir
- 1724 Capistrano Cir
- 2318 Canada Blvd
- 1700 Capistrano Cir
- 2309 Sylvan Ln
- 2315 Sylvan Ln
- 1711 Capistrano Cir
- 1717 Capistrano Cir
- 1707 Capistrano Cir
- 2314 Canada Blvd
- 1728 Capistrano Cir
- 1721 Capistrano Cir
- 2317 Sylvan Ln
- 1701 Capistrano Cir
- 2305 Sylvan Ln
- 1730 Capistrano Cir
- 1727 Capistrano Cir
- 2323 Sylvan Ln
- 2412 Canada Blvd
Your Personal Tour Guide
Ask me questions while you tour the home.