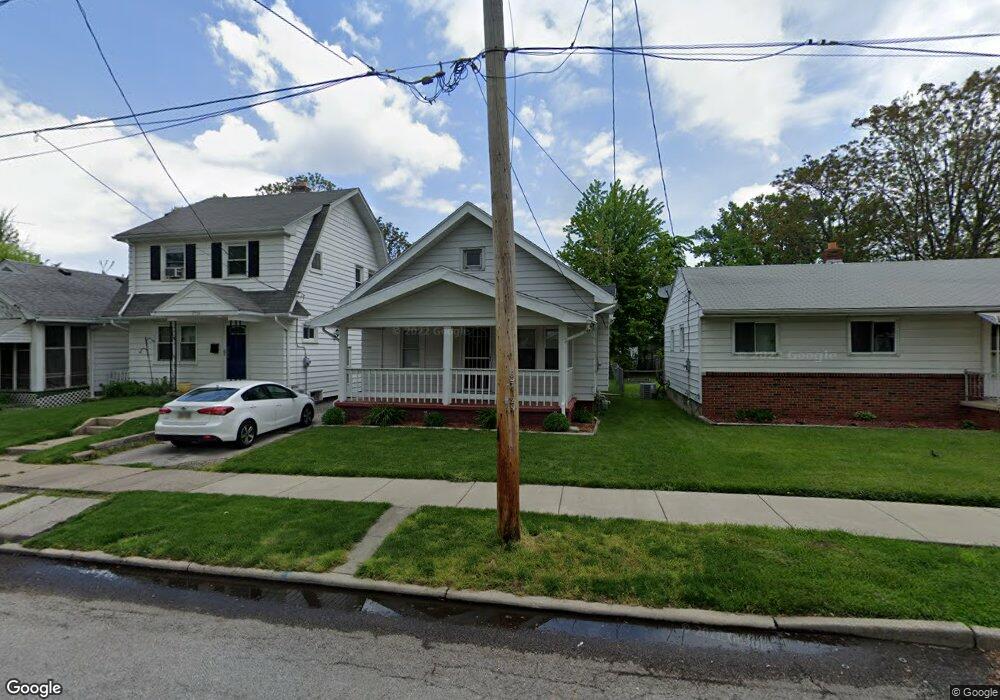
1714 Duncan Rd Toledo, OH 43613
DeVeaux NeighborhoodEstimated Value: $51,000 - $107,000
2
Beds
1
Bath
804
Sq Ft
$91/Sq Ft
Est. Value
About This Home
This home is located at 1714 Duncan Rd, Toledo, OH 43613 and is currently estimated at $73,300, approximately $91 per square foot. 1714 Duncan Rd is a home located in Lucas County with nearby schools including McKinley Stemm Academy, Start High School, and Hope Learning Academy of Toledo.
Ownership History
Date
Name
Owned For
Owner Type
Purchase Details
Closed on
Nov 24, 2015
Sold by
Denune Ralph
Bought by
1711 Duncan Llc
Current Estimated Value
Purchase Details
Closed on
Nov 3, 2014
Sold by
Spahr Sheila
Bought by
2735 Holdings Ltd
Purchase Details
Closed on
Feb 23, 2011
Sold by
Ken She Ltd
Bought by
Spahr Sheila
Purchase Details
Closed on
Nov 27, 2009
Sold by
Ftl Properties Limited
Bought by
Ken She Ltd
Purchase Details
Closed on
Feb 2, 2006
Sold by
Henderson Arvel R and Henderson Arvel Ray
Bought by
Ftl Properties Ltd
Purchase Details
Closed on
Aug 9, 2000
Sold by
Greeley Troy A and Greeley Joseph P
Bought by
Henderson Ii Arvel R
Home Financials for this Owner
Home Financials are based on the most recent Mortgage that was taken out on this home.
Original Mortgage
$53,241
Interest Rate
8.12%
Mortgage Type
Purchase Money Mortgage
Purchase Details
Closed on
Oct 19, 1988
Sold by
Greeley Lawrence R
Purchase Details
Closed on
May 13, 1988
Sold by
Poston Hazel E
Create a Home Valuation Report for This Property
The Home Valuation Report is an in-depth analysis detailing your home's value as well as a comparison with similar homes in the area
Home Values in the Area
Average Home Value in this Area
Purchase History
| Date | Buyer | Sale Price | Title Company |
|---|---|---|---|
| 1711 Duncan Llc | $8,000 | None Available | |
| 2735 Holdings Ltd | -- | None Available | |
| Spahr Sheila | -- | Louisville Title Agency For | |
| Ken She Ltd | $10,700 | Louisville Title Agency For | |
| Ftl Properties Ltd | -- | None Available | |
| Henderson Ii Arvel R | $32,500 | Midland | |
| -- | $19,000 | -- | |
| -- | $16,500 | -- |
Source: Public Records
Mortgage History
| Date | Status | Borrower | Loan Amount |
|---|---|---|---|
| Previous Owner | Henderson Ii Arvel R | $53,241 |
Source: Public Records
Tax History Compared to Growth
Tax History
| Year | Tax Paid | Tax Assessment Tax Assessment Total Assessment is a certain percentage of the fair market value that is determined by local assessors to be the total taxable value of land and additions on the property. | Land | Improvement |
|---|---|---|---|---|
| 2024 | $562 | $17,745 | $6,125 | $11,620 |
| 2023 | $994 | $14,875 | $3,640 | $11,235 |
| 2022 | $998 | $14,875 | $3,640 | $11,235 |
| 2021 | $1,022 | $14,875 | $3,640 | $11,235 |
| 2020 | $1,113 | $14,420 | $3,500 | $10,920 |
| 2019 | $1,082 | $14,420 | $3,500 | $10,920 |
| 2018 | $1,087 | $14,420 | $3,500 | $10,920 |
| 2017 | $1,115 | $14,105 | $3,430 | $10,675 |
| 2016 | $1,116 | $40,300 | $9,800 | $30,500 |
| 2015 | $1,106 | $40,300 | $9,800 | $30,500 |
| 2014 | $1,368 | $14,110 | $3,430 | $10,680 |
| 2013 | $912 | $14,110 | $3,430 | $10,680 |
Source: Public Records
Map
Nearby Homes
- 1735 Wychwood St
- 1747 Duncan Rd
- 1820 Marne Ave
- 1804 Bigelow St
- 1814 Bigelow St
- 1759 Talbot St
- 1952 Fairfax Rd
- 3511 Burton Ave
- 1840 Talbot St
- 3640 Torrance Dr
- 2017 Marlow Rd
- 3022 Isabella St
- 1814 Balkan Place
- 1749 Berdan Ave
- 3751 Jackman Rd
- 1935 Talbot St
- 1815 Berdan Ave
- 1846 Balkan Place
- 3505 Watson Ave
- 2045 Fairfax Rd
- 1716 Duncan Rd
- 1708 Duncan Rd
- 1720 Duncan Rd
- 1722 Duncan Rd
- 1702 Duncan Rd
- 1717 Wychwood St
- 1711 Wychwood St
- 1726 Duncan Rd
- 1721 Wychwood St
- 1705 Wychwood St
- 1723 Wychwood St
- 1709 Wychwood St
- 1728 Duncan Rd
- 1715 Duncan Rd
- 1703 Wychwood St
- 1711 Duncan Rd
- 1721 Duncan Rd
- 1723 Duncan Rd
- 1732 Duncan Rd
- 1705 Duncan Rd