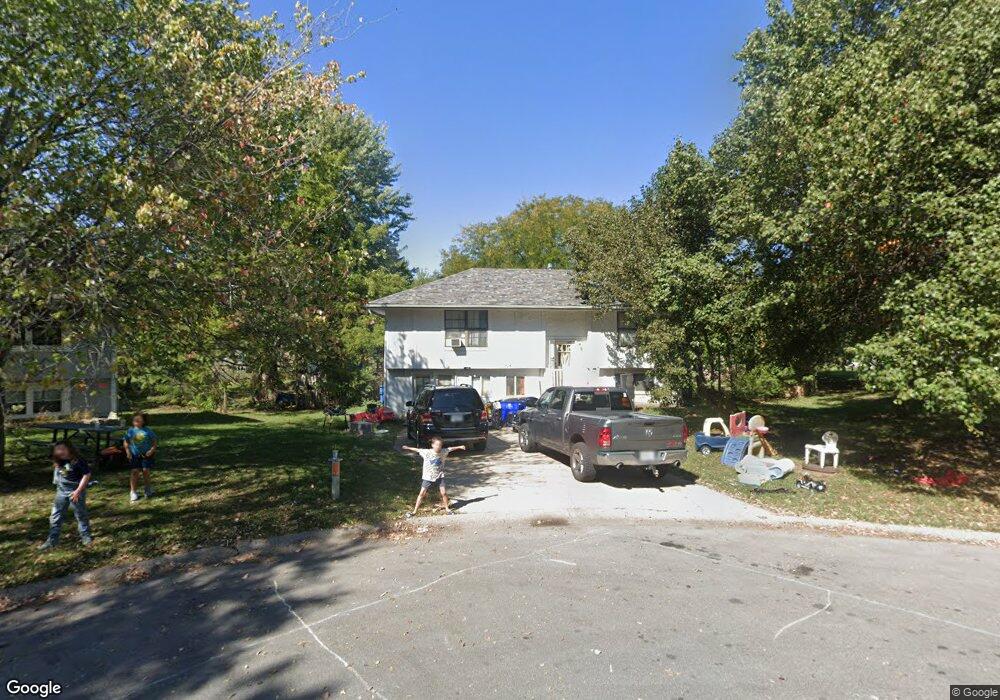
1714 NE White Dr Lees Summit, MO 64086
Estimated Value: $246,936 - $267,000
3
Beds
2
Baths
984
Sq Ft
$259/Sq Ft
Est. Value
About This Home
This home is located at 1714 NE White Dr, Lees Summit, MO 64086 and is currently estimated at $254,734, approximately $258 per square foot. 1714 NE White Dr is a home located in Jackson County with nearby schools including Meadow Lane Elementary School, Bernard C. Campbell Middle School, and Lee's Summit North High School.
Ownership History
Date
Name
Owned For
Owner Type
Purchase Details
Closed on
Oct 29, 2020
Sold by
Blackmore Sharyl A
Bought by
Blackmore Stefani J
Current Estimated Value
Purchase Details
Closed on
Aug 4, 2010
Sold by
Blackmore Cecil O M and Blackmore Sharyl A
Bought by
Blackmore Cecil O M and Blackmore Sharyl A
Purchase Details
Closed on
Jan 29, 2002
Sold by
Blackmore George M and Blackmore Shannon D
Bought by
Blackmore Cecil O M and Blackmore Sharyl A
Purchase Details
Closed on
Nov 2, 1999
Bought by
Blackmore George M
Home Financials for this Owner
Home Financials are based on the most recent Mortgage that was taken out on this home.
Original Mortgage
$75,767
Outstanding Balance
$23,308
Interest Rate
7.85%
Mortgage Type
FHA
Estimated Equity
$231,426
Create a Home Valuation Report for This Property
The Home Valuation Report is an in-depth analysis detailing your home's value as well as a comparison with similar homes in the area
Home Values in the Area
Average Home Value in this Area
Purchase History
| Date | Buyer | Sale Price | Title Company |
|---|---|---|---|
| Blackmore Stefani J | -- | None Available | |
| Blackmore Cecil O M | -- | None Available | |
| Blackmore Cecil O M | -- | Premier Land Title Company | |
| Blackmore George M | -- | -- |
Source: Public Records
Mortgage History
| Date | Status | Borrower | Loan Amount |
|---|---|---|---|
| Open | Blackmore George M | $75,767 |
Source: Public Records
Tax History
| Year | Tax Paid | Tax Assessment Tax Assessment Total Assessment is a certain percentage of the fair market value that is determined by local assessors to be the total taxable value of land and additions on the property. | Land | Improvement |
|---|---|---|---|---|
| 2025 | $1,794 | $28,568 | $6,802 | $21,766 |
| 2024 | $1,781 | $24,843 | $7,505 | $17,338 |
| 2023 | $1,781 | $24,843 | $3,848 | $20,995 |
| 2022 | $2,393 | $29,640 | $3,992 | $25,648 |
| 2021 | $2,442 | $29,640 | $3,992 | $25,648 |
| 2020 | $2,344 | $28,165 | $3,992 | $24,173 |
| 2019 | $2,280 | $28,165 | $3,992 | $24,173 |
| 2018 | $2,138 | $24,513 | $3,475 | $21,038 |
| 2017 | $2,138 | $24,513 | $3,475 | $21,038 |
| 2016 | $1,914 | $21,717 | $2,413 | $19,304 |
Source: Public Records
Map
Nearby Homes
- 1708 NE Balboa St
- 809 NE Cedar St
- 810 NE Chestnut St
- 809 NE Mulberry St
- 718 NE Mulberry St
- 717 NE Mulberry St
- 1490 NE Independence Ave
- 1525 NE Yorkshire Dr
- 1625 NE Thames Dr
- 400 NE Mulberry St
- 401 NE Mulberry St
- 1350 NE Colbern Rd
- 1300 NE Browning Ln
- 1141 NE Hunters Ridge
- .342 acres NE Victoria Dr
- 1617 NE Auburn Dr
- 1128 NE Westwind Dr
- 1412 NE Ernest Way
- 1401 NE Ernest Way
- 1408 NE Applewood Ct
- 1712 NE White Dr
- 1715 NE White Dr Unit B
- 835 NE Pollard St
- 1710 NE White Dr
- 831 NE Pollard St
- 1711 NE White Dr Unit A
- 1711 NE White Dr
- 832 NE Pollard St
- 1708 NE White Dr
- 828 NE Pollard St
- 1709 NE White Dr Unit A
- 823 NE Pollard St
- 832 NE Cambridge Dr
- 1707 NE White Dr
- 824 NE Pollard St
- 837 NE Cambridge Dr
- 1707 NE White Dr
- 1707 NE White Dr Unit A
- 828 NE Cambridge Dr
- 1706 NE White Dr
Your Personal Tour Guide
Ask me questions while you tour the home.