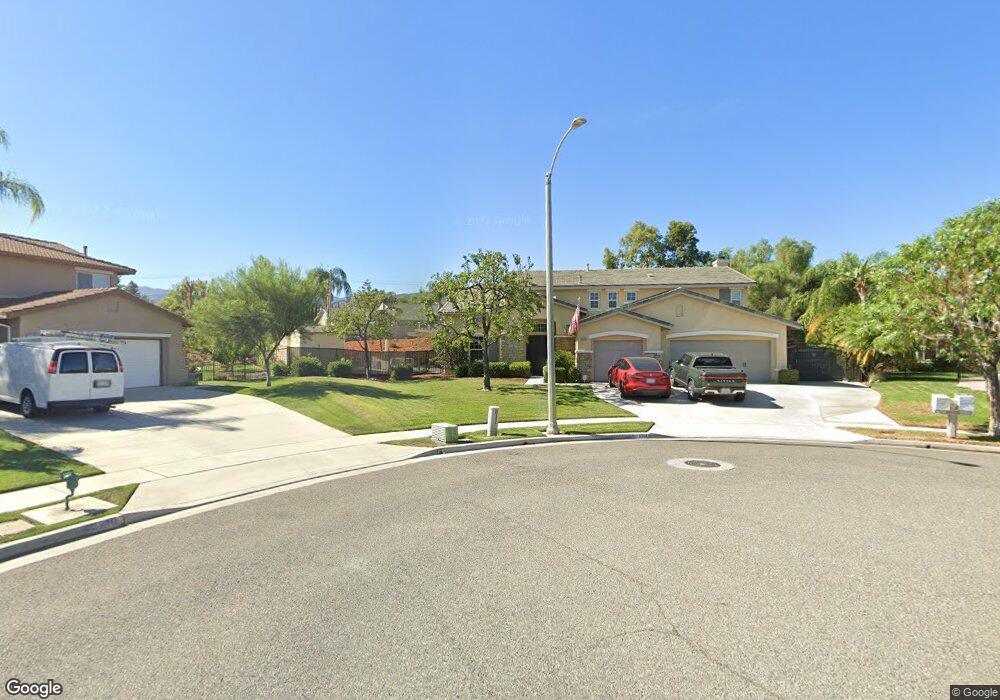
1714 Via Fresco Cir Corona, CA 92881
South Corona NeighborhoodEstimated Value: $1,289,530 - $1,443,000
5
Beds
3
Baths
3,939
Sq Ft
$344/Sq Ft
Est. Value
About This Home
This home is located at 1714 Via Fresco Cir, Corona, CA 92881 and is currently estimated at $1,355,383, approximately $344 per square foot. 1714 Via Fresco Cir is a home located in Riverside County with nearby schools including Orange Elementary School, Citrus Hills Intermediate School, and Santiago High School.
Ownership History
Date
Name
Owned For
Owner Type
Purchase Details
Closed on
Aug 7, 2020
Sold by
Kelly Paul J and Kelly Sara B
Bought by
Kelly Paul J and Kelly Sara B
Current Estimated Value
Home Financials for this Owner
Home Financials are based on the most recent Mortgage that was taken out on this home.
Original Mortgage
$510,000
Outstanding Balance
$452,406
Interest Rate
3%
Mortgage Type
New Conventional
Estimated Equity
$902,977
Purchase Details
Closed on
Jun 27, 2013
Sold by
Kelly Paul J and Kelly Sara B
Bought by
Kelly Paul and Kelly Sara
Purchase Details
Closed on
Aug 22, 2002
Sold by
Woodbridge Sommerset Estates Llc
Bought by
Kelly Paul J and Kelly Sara B
Home Financials for this Owner
Home Financials are based on the most recent Mortgage that was taken out on this home.
Original Mortgage
$342,800
Interest Rate
6.37%
Create a Home Valuation Report for This Property
The Home Valuation Report is an in-depth analysis detailing your home's value as well as a comparison with similar homes in the area
Home Values in the Area
Average Home Value in this Area
Purchase History
| Date | Buyer | Sale Price | Title Company |
|---|---|---|---|
| Kelly Paul J | -- | Corinthian Title Company | |
| Kelly Paul | -- | None Available | |
| Kelly Paul J | $429,000 | Fidelity National Title Co |
Source: Public Records
Mortgage History
| Date | Status | Borrower | Loan Amount |
|---|---|---|---|
| Open | Kelly Paul J | $510,000 | |
| Closed | Kelly Paul J | $342,800 |
Source: Public Records
Tax History Compared to Growth
Tax History
| Year | Tax Paid | Tax Assessment Tax Assessment Total Assessment is a certain percentage of the fair market value that is determined by local assessors to be the total taxable value of land and additions on the property. | Land | Improvement |
|---|---|---|---|---|
| 2025 | $9,548 | $682,637 | $173,808 | $508,829 |
| 2023 | $9,548 | $607,110 | $167,059 | $440,051 |
| 2022 | $8,762 | $595,207 | $163,784 | $431,423 |
| 2021 | $8,642 | $583,537 | $160,573 | $422,964 |
| 2020 | $8,706 | $577,555 | $158,927 | $418,628 |
| 2019 | $8,556 | $566,231 | $155,811 | $410,420 |
| 2018 | $8,413 | $555,129 | $152,757 | $402,372 |
| 2017 | $8,262 | $544,245 | $149,762 | $394,483 |
| 2016 | $8,254 | $533,575 | $146,826 | $386,749 |
| 2015 | $8,218 | $525,562 | $144,621 | $380,941 |
| 2014 | $8,146 | $515,269 | $141,789 | $373,480 |
Source: Public Records
Map
Nearby Homes
- 1610 Via Roma Cir
- 2955 Villa Catalonia Ct
- 1477 Floral Park St
- 3704 Howe St
- 1456 Roadrunner Dr
- 3675 Sunmeadow St
- 1414 Baldwin Dr
- 1333 Soundview Cir
- 1395 Pinewood Dr
- 7401 Liberty Ave
- 1778 Kapalua Bay Ln
- 1284 Longport Way
- 20280 Newton St
- 1236 Emeraldport St
- 20171 Corona St
- 1236 Kendrick Ct
- 1775 Honors Ln
- 19870 Katy Way
- 4050 Lester Ave
- 1180 Cleveland Way
- 1708 Via Fresco Cir
- 1719 Via Fresco Cir
- 1625 Liberty Dr
- 1700 Liberty Dr
- 1690 Via Finaldi Way
- 1713 Via Fresco Cir
- 1720 Liberty Dr
- 1707 Via Fresco Cir
- 1680 Via Finaldi Way
- 1617 Liberty Dr
- 1622 Liberty Dr
- 1722 Via Provincia Cir
- 3250 Howe St
- 1616 Liberty Dr
- 1675 Via Finaldi Way
- 1716 Via Provincia Cir
- 1670 Via Finaldi Way
- 1599 Liberty Dr
- 3255 Nelson St
- 3260 Howe St