Estimated Value: $816,000 - $1,369,000
3
Beds
2
Baths
1,480
Sq Ft
$773/Sq Ft
Est. Value
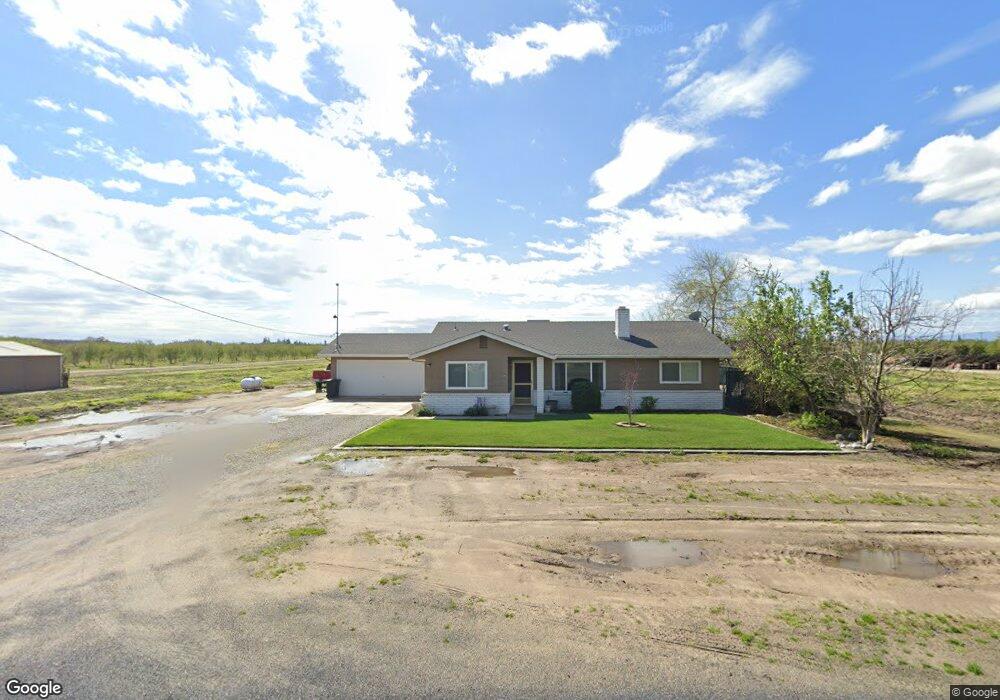
About This Home
This home is located at 17140 Colony Rd, Ripon, CA 95366 and is currently estimated at $1,143,666, approximately $772 per square foot. 17140 Colony Rd is a home located in San Joaquin County with nearby schools including Colony Oak Elementary School, Ripona Elementary School, and Park View Elementary School.
Ownership History
Date
Name
Owned For
Owner Type
Purchase Details
Closed on
Oct 8, 2025
Sold by
Terpstra Steven T and Terpstra Nancy L
Bought by
Terpstra
Current Estimated Value
Purchase Details
Closed on
Feb 20, 2013
Sold by
Terpstra Steven and Terpstra Nancy
Bought by
Terpstra Steven and Terpstra Nancy
Home Financials for this Owner
Home Financials are based on the most recent Mortgage that was taken out on this home.
Original Mortgage
$100,000
Interest Rate
3.49%
Mortgage Type
Credit Line Revolving
Purchase Details
Closed on
Apr 26, 2012
Sold by
Terpstra Harry Thomas and Terpstra Rhea Alice
Bought by
Terpstra Steven and Terpstra Nancy
Purchase Details
Closed on
Oct 3, 2011
Sold by
Terpstra Thomas and Terpstra Ladonna
Bought by
Terpstra Steven and Terpstra Nancy
Purchase Details
Closed on
Jan 23, 2007
Sold by
Vanderwal Peter Allan
Bought by
Terpstra Steven and Terpstra Nancy
Purchase Details
Closed on
Jun 10, 1997
Sold by
Cornelia Vander Wal
Bought by
Wal Cornelia Vander
Create a Home Valuation Report for This Property
The Home Valuation Report is an in-depth analysis detailing your home's value as well as a comparison with similar homes in the area
Purchase History
| Date | Buyer | Sale Price | Title Company |
|---|---|---|---|
| Terpstra | -- | None Listed On Document | |
| Terpstra Steven | -- | Old Republic Title Company | |
| Terpstra Steven | $120,000 | None Available | |
| Terpstra Steven | $120,000 | None Available | |
| Terpstra Steven | $900,000 | First American Title Co | |
| Wal Cornelia Vander | -- | -- |
Source: Public Records
Mortgage History
| Date | Status | Borrower | Loan Amount |
|---|---|---|---|
| Previous Owner | Terpstra Steven | $100,000 |
Source: Public Records
Tax History
| Year | Tax Paid | Tax Assessment Tax Assessment Total Assessment is a certain percentage of the fair market value that is determined by local assessors to be the total taxable value of land and additions on the property. | Land | Improvement |
|---|---|---|---|---|
| 2025 | $9,235 | $846,869 | $461,585 | $385,284 |
| 2024 | $8,876 | $810,657 | $452,535 | $358,122 |
| 2023 | $9,441 | $865,200 | $443,662 | $421,538 |
| 2022 | $9,291 | $848,240 | $434,963 | $413,277 |
| 2021 | $9,148 | $831,607 | $426,435 | $405,172 |
| 2020 | $9,065 | $823,082 | $422,063 | $401,019 |
| 2019 | $8,909 | $806,944 | $413,788 | $393,156 |
| 2018 | $8,771 | $791,122 | $405,675 | $385,447 |
| 2017 | $8,600 | $775,611 | $397,721 | $377,890 |
| 2016 | $8,457 | $760,406 | $389,924 | $370,482 |
| 2014 | $5,183 | $476,700 | $312,900 | $163,800 |
Source: Public Records
Map
Nearby Homes
- 1720 Fairway Oaks Ct
- 1234 Murphy Rd
- 2345 Murphy Rd
- 18650 E Eugenia Ave
- 749 Nancy Dr
- 788 E Milgeo Ave
- 0 Murphy Rd Unit 225148414
- 163 Franklin Ln
- 446 Meyenberg Ave
- 244 California St
- 346 S Manley Rd
- 183 Haller Ct
- 1537 Atlantic Ave
- 845 Sunrise Ave
- 243 John Kamps Way
- 1842 Flagstone Dr
- 565 Bodeson Ct
- 1678 Calhoun Ave
- 410 Pine St
- 150 N Acacia Ave
- 17211 Colony Rd
- 17225 Colony Rd
- 17108 Colony Rd
- 17135 Colony Rd
- 17074 W Colony Rd
- 17074 Colony Rd
- 16887 Colony Rd
- 16882 Colony Rd
- 17065 Colony Rd
- 17374 E River Rd
- 16683 Colony Rd
- 17271 E Milgeo Ave
- 16776 Colony Rd
- 17576 E River Rd
- 16969 E Milgeo Ave
- 16810 E River Rd
- 16990 E River Rd
- 17023 E Milgeo Ave
- 892 Markham Way
- 2097 Fairway Oaks Dr
Your Personal Tour Guide
Ask me questions while you tour the home.