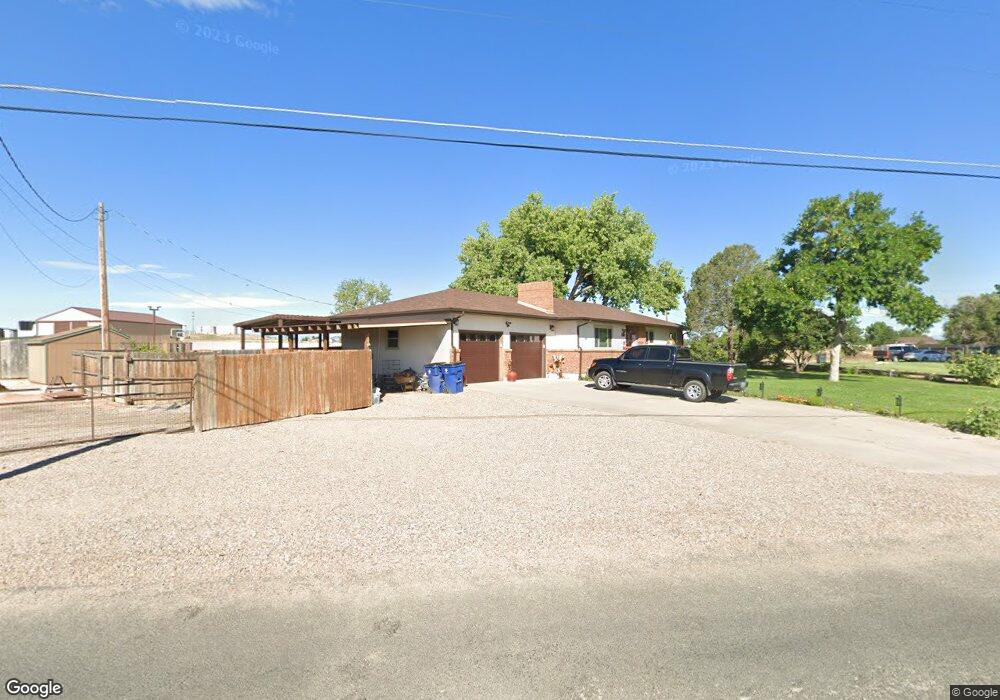
1715 27th Ln Pueblo, CO 81006
Estimated Value: $444,000 - $466,000
5
Beds
5
Baths
2,518
Sq Ft
$180/Sq Ft
Est. Value
About This Home
This home is located at 1715 27th Ln, Pueblo, CO 81006 and is currently estimated at $452,527, approximately $179 per square foot. 1715 27th Ln is a home located in Pueblo County with nearby schools including South Mesa Elementary School, Pleasant View Middle School, and Pueblo County High School.
Ownership History
Date
Name
Owned For
Owner Type
Purchase Details
Closed on
Aug 28, 2012
Sold by
Pannunzio John R and Pannunzio Dotti
Bought by
Granato Joseph P
Current Estimated Value
Home Financials for this Owner
Home Financials are based on the most recent Mortgage that was taken out on this home.
Original Mortgage
$223,819
Outstanding Balance
$156,182
Interest Rate
3.75%
Mortgage Type
FHA
Estimated Equity
$296,345
Purchase Details
Closed on
Sep 23, 2004
Sold by
Martinez Louis S
Bought by
Pannunzio John R + Dotti
Purchase Details
Closed on
Mar 6, 1992
Sold by
Viola Joe E + Betty J
Bought by
Martinez Louis S
Purchase Details
Closed on
Sep 30, 1980
Bought by
Viola Joe E + Betty J
Purchase Details
Closed on
Aug 29, 1979
Bought by
Same
Purchase Details
Closed on
Jan 4, 1979
Sold by
De Herrera Construction Co
Bought by
Deherrera David + Diane
Purchase Details
Closed on
Sep 8, 1978
Bought by
De Herrera Construction Co
Create a Home Valuation Report for This Property
The Home Valuation Report is an in-depth analysis detailing your home's value as well as a comparison with similar homes in the area
Home Values in the Area
Average Home Value in this Area
Purchase History
| Date | Buyer | Sale Price | Title Company |
|---|---|---|---|
| Granato Joseph P | $228,000 | Land Title Guarantee Company | |
| Pannunzio John R + Dotti | $183,000 | -- | |
| Martinez Louis S | $82,000 | -- | |
| Viola Joe E + Betty J | $63,500 | -- | |
| Same | -- | -- | |
| Deherrera David + Diane | -- | -- | |
| De Herrera Construction Co | -- | -- |
Source: Public Records
Mortgage History
| Date | Status | Borrower | Loan Amount |
|---|---|---|---|
| Open | Granato Joseph P | $223,819 |
Source: Public Records
Tax History Compared to Growth
Tax History
| Year | Tax Paid | Tax Assessment Tax Assessment Total Assessment is a certain percentage of the fair market value that is determined by local assessors to be the total taxable value of land and additions on the property. | Land | Improvement |
|---|---|---|---|---|
| 2024 | $2,658 | $25,470 | -- | -- |
| 2023 | $2,689 | $29,160 | $3,750 | $25,410 |
| 2022 | $2,385 | $22,855 | $2,710 | $20,145 |
| 2021 | $2,446 | $23,520 | $2,790 | $20,730 |
| 2020 | $2,077 | $19,920 | $2,570 | $17,350 |
| 2019 | $2,072 | $19,927 | $2,574 | $17,353 |
| 2018 | $1,756 | $16,877 | $2,592 | $14,285 |
| 2017 | $1,758 | $16,877 | $2,592 | $14,285 |
| 2016 | $1,749 | $16,820 | $2,866 | $13,954 |
| 2015 | $1,741 | $16,820 | $2,866 | $13,954 |
| 2014 | $1,590 | $15,404 | $2,866 | $12,538 |
Source: Public Records
Map
Nearby Homes
- 1620 Johneva St
- 27111 Preston Rd
- 27454 Preston Rd
- Lot C Manning Rd
- Lot C Manning Rd
- 1557 28th Ln
- 1470 Villa Spanada St
- 1725 Harlow Ave
- 1419 27 1 2 Ln
- 27193 County Farm Rd
- 27875 County Farm Rd
- 2074 Oriole Rd
- 2291 Chantala Ave
- 1345 Terry Cir
- Lot 13 Fallview Dr
- 29767 Preston Rd
- 1143 25th Ln
- 28513 Hillside Rd
- TBD 27th Ln
- 1131 24 1 2 Ln