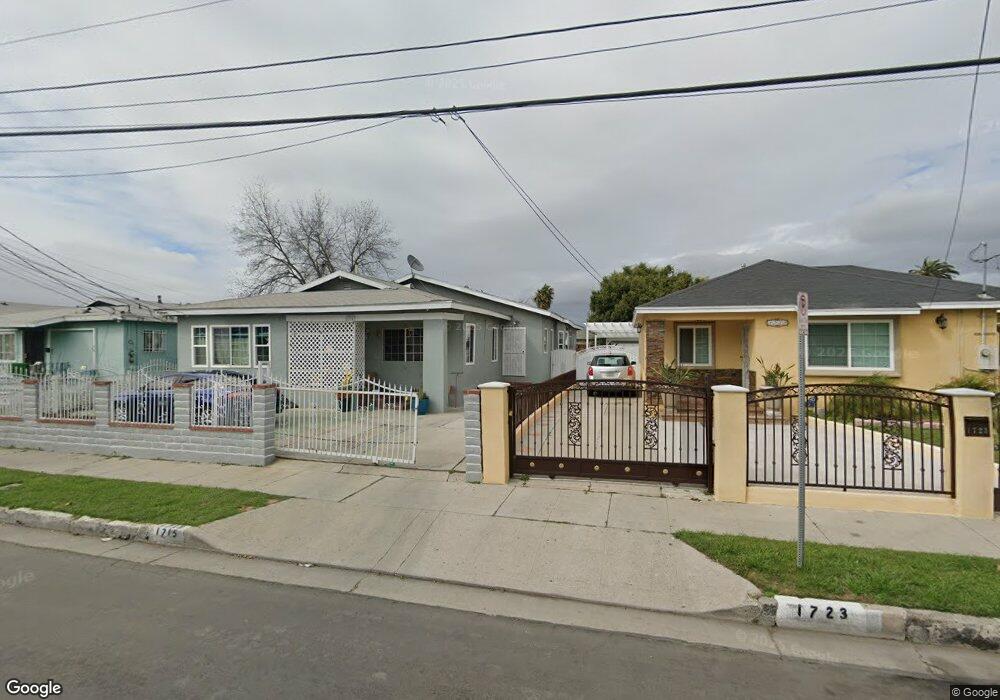
1715 E 114th St Los Angeles, CA 90059
Watts NeighborhoodEstimated Value: $638,000 - $769,000
4
Beds
2
Baths
2,146
Sq Ft
$321/Sq Ft
Est. Value
About This Home
This home is located at 1715 E 114th St, Los Angeles, CA 90059 and is currently estimated at $689,146, approximately $321 per square foot. 1715 E 114th St is a home located in Los Angeles County with nearby schools including Lovelia P. Flournoy Elementary School, Edwin Markham Middle School, and Jordan High School.
Ownership History
Date
Name
Owned For
Owner Type
Purchase Details
Closed on
Jul 9, 2025
Sold by
Delgado Gonzalez Salvador
Bought by
Delgado Family Trust and Gonzalez
Current Estimated Value
Purchase Details
Closed on
Jun 17, 1999
Sold by
Tryon Floyd
Bought by
Delgado Salvador
Home Financials for this Owner
Home Financials are based on the most recent Mortgage that was taken out on this home.
Original Mortgage
$137,655
Interest Rate
9.5%
Purchase Details
Closed on
Aug 31, 1998
Sold by
Castellon Jose
Bought by
Tryon Floyd
Purchase Details
Closed on
Jun 8, 1998
Sold by
Ocwen Federal Bank Fsb
Bought by
Castellon Jose
Home Financials for this Owner
Home Financials are based on the most recent Mortgage that was taken out on this home.
Original Mortgage
$89,700
Interest Rate
7.11%
Purchase Details
Closed on
Jul 14, 1997
Sold by
Corona Angel
Bought by
Ocwen Federal Bank Fsb
Create a Home Valuation Report for This Property
The Home Valuation Report is an in-depth analysis detailing your home's value as well as a comparison with similar homes in the area
Home Values in the Area
Average Home Value in this Area
Purchase History
| Date | Buyer | Sale Price | Title Company |
|---|---|---|---|
| Delgado Family Trust | -- | None Listed On Document | |
| Delgado Salvador | $145,000 | Gateway Title | |
| Tryon Floyd | -- | First Southwestern Title Co | |
| Castellon Jose | $86,000 | Fidelity National Title Co | |
| Ocwen Federal Bank Fsb | $107,500 | Chicago Title Co |
Source: Public Records
Mortgage History
| Date | Status | Borrower | Loan Amount |
|---|---|---|---|
| Previous Owner | Delgado Salvador | $137,655 | |
| Previous Owner | Castellon Jose | $89,700 |
Source: Public Records
Tax History
| Year | Tax Paid | Tax Assessment Tax Assessment Total Assessment is a certain percentage of the fair market value that is determined by local assessors to be the total taxable value of land and additions on the property. | Land | Improvement |
|---|---|---|---|---|
| 2025 | $3,275 | $222,682 | $70,689 | $151,993 |
| 2024 | $3,275 | $218,316 | $69,303 | $149,013 |
| 2023 | $3,220 | $214,037 | $67,945 | $146,092 |
| 2022 | $3,089 | $209,841 | $66,613 | $143,228 |
| 2021 | $3,041 | $205,727 | $65,307 | $140,420 |
| 2019 | $2,959 | $199,627 | $63,371 | $136,256 |
| 2018 | $2,791 | $195,714 | $62,129 | $133,585 |
| 2016 | $2,647 | $188,116 | $59,717 | $128,399 |
| 2015 | $2,608 | $185,291 | $58,820 | $126,471 |
| 2014 | $2,620 | $181,662 | $57,668 | $123,994 |
Source: Public Records
Map
Nearby Homes
- 1718 E 113th St
- 1764 E 113th St
- 1637 E 115th St
- 1783 E Imperial Hwy
- 1705 E 111th Place
- 11114 Willowbrook Ave
- 1675 E 111th St
- 11012 Willowbrook Ave
- 11008 Willowbrook Ave
- 1648 E 110th St
- 1644 E 110th St
- 1693 E 110th St
- 1954 E 113th St
- 1962 E 114th St
- 1964 E 114th St
- 1954 E 112th St
- 1624 E 109th St
- 10952 Wilmington Ave
- 11727 Alabama St
- 10931 Anzac Ave
- 1723 E 114th St
- 1713 E 114th St
- 1707 E 114th St
- 1701 E 114th St
- 1714 E 113th St
- 1712 E 113th St
- 1710 E 113th St
- 1718 E 114th St
- 1712 E 114th St
- 1706 E 113th St
- 1722 E 114th St
- 1671 E 114th St
- 1706 E 114th St
- 9801 S Grandee Ave
- 1704 E 113th St
- 1752 E 113th St
- 1730 E 114th St
- 1702 E 114th St
- 1667 E 114th St
- 1674 E 113th St
Your Personal Tour Guide
Ask me questions while you tour the home.