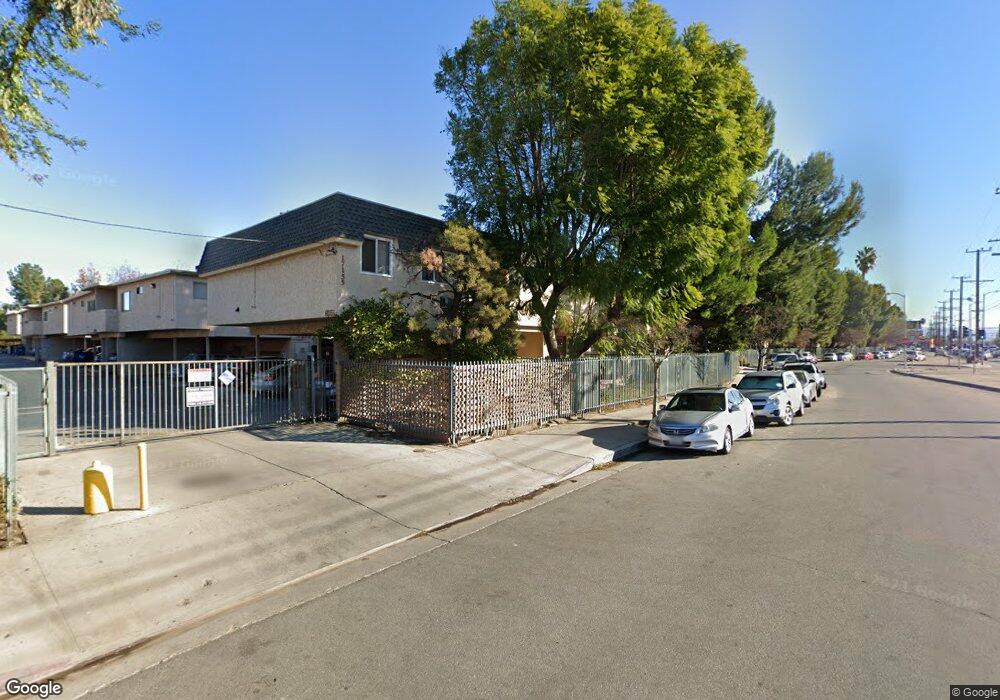
17151 Roscoe Blvd Unit 17 Northridge, CA 91325
Estimated Value: $390,734 - $469,000
2
Beds
2
Baths
1,071
Sq Ft
$398/Sq Ft
Est. Value
About This Home
This home is located at 17151 Roscoe Blvd Unit 17, Northridge, CA 91325 and is currently estimated at $425,934, approximately $397 per square foot. 17151 Roscoe Blvd Unit 17 is a home located in Los Angeles County with nearby schools including Stagg Street Elementary, Northridge Middle School, and Northridge Academy High.
Ownership History
Date
Name
Owned For
Owner Type
Purchase Details
Closed on
Dec 28, 1995
Sold by
Fidelity Federal Bank Fsb
Bought by
Federal Home Loan Mortgage Corporation
Current Estimated Value
Home Financials for this Owner
Home Financials are based on the most recent Mortgage that was taken out on this home.
Original Mortgage
$26,950
Interest Rate
7.37%
Purchase Details
Closed on
Dec 27, 1995
Sold by
Federal Home Loan Mortgage Corporation
Bought by
Levin Boris J and Levin Marina A
Home Financials for this Owner
Home Financials are based on the most recent Mortgage that was taken out on this home.
Original Mortgage
$26,950
Interest Rate
7.37%
Purchase Details
Closed on
Sep 13, 1995
Sold by
Mihjazi Ayman M and Fidelity Federal Bank Fsb
Bought by
Fidelity Federal Bank Fsb
Create a Home Valuation Report for This Property
The Home Valuation Report is an in-depth analysis detailing your home's value as well as a comparison with similar homes in the area
Home Values in the Area
Average Home Value in this Area
Purchase History
| Date | Buyer | Sale Price | Title Company |
|---|---|---|---|
| Federal Home Loan Mortgage Corporation | -- | -- | |
| Levin Boris J | $38,500 | Fidelity National Title Ins | |
| Fidelity Federal Bank Fsb | $37,000 | American Title Ins Co |
Source: Public Records
Mortgage History
| Date | Status | Borrower | Loan Amount |
|---|---|---|---|
| Closed | Levin Boris J | $26,950 |
Source: Public Records
Tax History
| Year | Tax Paid | Tax Assessment Tax Assessment Total Assessment is a certain percentage of the fair market value that is determined by local assessors to be the total taxable value of land and additions on the property. | Land | Improvement |
|---|---|---|---|---|
| 2025 | $925 | $63,922 | $16,596 | $47,326 |
| 2024 | $925 | $62,670 | $16,271 | $46,399 |
| 2023 | $910 | $61,442 | $15,952 | $45,490 |
| 2022 | $870 | $60,239 | $15,640 | $44,599 |
| 2021 | $854 | $59,059 | $15,334 | $43,725 |
| 2019 | $830 | $57,309 | $14,880 | $42,429 |
| 2018 | $801 | $56,187 | $14,589 | $41,598 |
| 2016 | $753 | $54,007 | $14,023 | $39,984 |
| 2015 | $743 | $53,197 | $13,813 | $39,384 |
| 2014 | $754 | $52,156 | $13,543 | $38,613 |
Source: Public Records
Map
Nearby Homes
- 17143 Roscoe Blvd
- 17131 Roscoe Blvd Unit 10
- 17045 Roscoe Blvd Unit 14
- 17105 Roscoe Blvd Unit 9
- 17241 Roscoe Blvd Unit 16
- 17200 Willard St
- 8147 Aldea Ave
- 8633 Balboa Blvd Unit 29
- 17371 Willard St
- 8009 Aldea Ave
- 8143 Lasaine Ave
- 8218 Encino Ave
- 7927 Paso Robles Ave
- 7911 Paso Robles Ave
- 7909 Aldea Ave
- 17545 Community St
- 7913 Lasaine Ave
- 17320 Gresham St
- 8241 Sophie Ct
- 7842 Lasaine Ave
- 17151 Roscoe Blvd
- 17131 Roscoe Blvd
- 17061 Roscoe Blvd Unit 8
- 17041 Roscoe Blvd Unit 5
- 17115 Roscoe Blvd Unit 2
- 17111 Roscoe Blvd
- 17061 Roscoe Blvd Unit 14
- 17105 Roscoe Blvd Unit 2
- 17105 Roscoe Blvd Unit 9
- 17131 Roscoe Blvd Unit 4
- 17061 Roscoe Blvd Unit 48
- 17151 Roscoe Blvd Unit 15
- 17151 Roscoe Blvd Unit 16
- 17151 Roscoe Blvd Unit 18
- 17151 Roscoe Blvd Unit 19
- 17143 Roscoe Blvd Unit 1
- 17143 Roscoe Blvd Unit 2
- 17143 Roscoe Blvd Unit 3
- 17143 Roscoe Blvd Unit 4
- 17143 Roscoe Blvd Unit 5
Your Personal Tour Guide
Ask me questions while you tour the home.