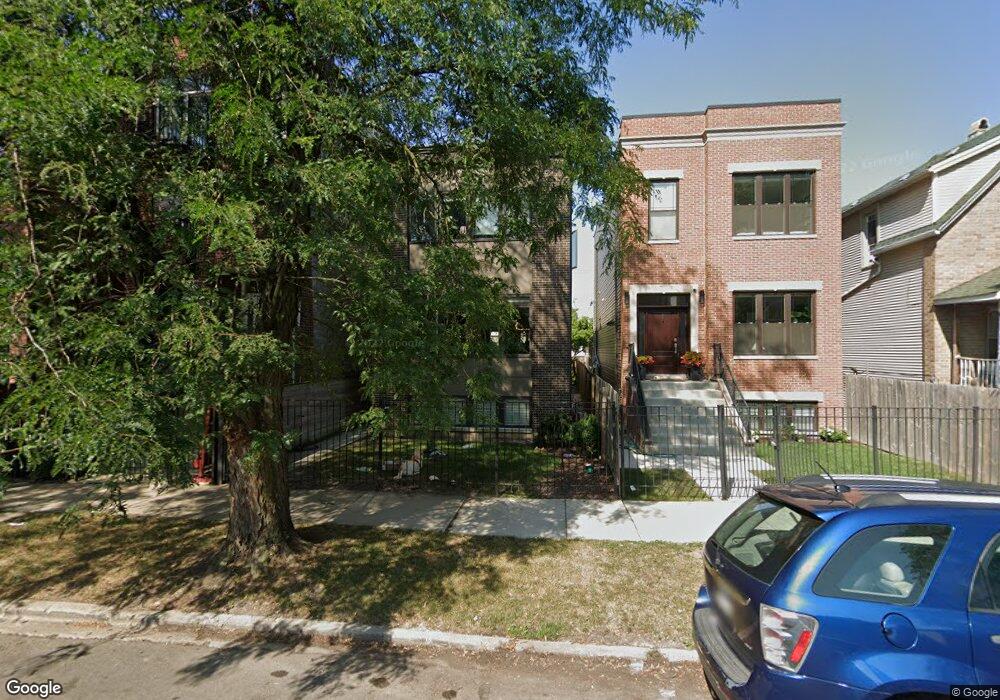
1716 N Albany Ave Chicago, IL 60647
Humboldt Park NeighborhoodEstimated Value: $907,000 - $1,036,560
4
Beds
5
Baths
1,824
Sq Ft
$541/Sq Ft
Est. Value
About This Home
This home is located at 1716 N Albany Ave, Chicago, IL 60647 and is currently estimated at $987,640, approximately $541 per square foot. 1716 N Albany Ave is a home located in Cook County with nearby schools including Yates Elementary School, Clemente Community Academy High School, and St. Sylvester School.
Ownership History
Date
Name
Owned For
Owner Type
Purchase Details
Closed on
Apr 16, 2016
Sold by
Shepherd Sarah and Shepherd Simon
Bought by
Binerer Buark and Binerer Yasemin
Current Estimated Value
Home Financials for this Owner
Home Financials are based on the most recent Mortgage that was taken out on this home.
Original Mortgage
$540,000
Outstanding Balance
$431,652
Interest Rate
3.87%
Mortgage Type
Adjustable Rate Mortgage/ARM
Estimated Equity
$555,988
Purchase Details
Closed on
Mar 22, 2013
Sold by
1716 Troya Investment Corp
Bought by
Shepherd Sarah and Shepherd Simon
Home Financials for this Owner
Home Financials are based on the most recent Mortgage that was taken out on this home.
Original Mortgage
$329,750
Interest Rate
3.62%
Mortgage Type
New Conventional
Purchase Details
Closed on
Jun 14, 2012
Sold by
Birkmeyer Robert E
Bought by
1716 Troya Investment Corp
Create a Home Valuation Report for This Property
The Home Valuation Report is an in-depth analysis detailing your home's value as well as a comparison with similar homes in the area
Home Values in the Area
Average Home Value in this Area
Purchase History
| Date | Buyer | Sale Price | Title Company |
|---|---|---|---|
| Binerer Buark | $580,000 | Chicago Title | |
| Shepherd Sarah | $425,500 | None Available | |
| 1716 Troya Investment Corp | $70,000 | None Available |
Source: Public Records
Mortgage History
| Date | Status | Borrower | Loan Amount |
|---|---|---|---|
| Open | Binerer Buark | $540,000 | |
| Previous Owner | Shepherd Sarah | $329,750 |
Source: Public Records
Tax History Compared to Growth
Tax History
| Year | Tax Paid | Tax Assessment Tax Assessment Total Assessment is a certain percentage of the fair market value that is determined by local assessors to be the total taxable value of land and additions on the property. | Land | Improvement |
|---|---|---|---|---|
| 2024 | $13,054 | $77,000 | $16,520 | $60,480 |
| 2023 | $12,666 | $65,000 | $13,275 | $51,725 |
| 2022 | $12,666 | $65,000 | $13,275 | $51,725 |
| 2021 | $12,401 | $65,000 | $13,275 | $51,725 |
| 2020 | $11,623 | $55,277 | $7,522 | $47,755 |
| 2019 | $11,651 | $61,419 | $7,522 | $53,897 |
| 2018 | $11,454 | $61,419 | $7,522 | $53,897 |
| 2017 | $8,880 | $44,626 | $6,637 | $37,989 |
| 2016 | $8,438 | $44,626 | $6,637 | $37,989 |
| 2015 | $7,697 | $44,626 | $6,637 | $37,989 |
| 2014 | $8,030 | $43,282 | $5,900 | $37,382 |
| 2013 | $7,872 | $43,282 | $5,900 | $37,382 |
Source: Public Records
Map
Nearby Homes
- 1753 N Kedzie Ave Unit 2
- 3132 W North Ave Unit 2
- 1739 N Whipple St Unit 1
- 1837 N Albany Ave
- 1717 N Humboldt Blvd Unit 2N
- 1747 N Spaulding Ave
- 3600-3608 W North Ave
- 1814 N Sawyer Ave
- 1902 N Albany Ave
- 1714 N Spaulding Ave Unit Garage
- 1622 N Spaulding Ave
- 1806 N Richmond St
- 1816 N Spaulding Ave Unit 8
- 1701 N Kimball Ave
- 1918 N Kedzie Ave
- 1728 N Francisco Ave
- 1918 N Humboldt Blvd
- 1928 N Kedzie Ave Unit 403
- 1928 N Kedzie Ave Unit 306
- 1922 N Humboldt Blvd
- 1716 N Albany Ave
- 1718 N Albany Ave
- 1712 N Albany Ave
- 1712 N Albany Ave Unit 3
- 1712 N Albany Ave Unit 2
- 1712 N Albany Ave Unit 1
- 1720 N Albany Ave
- 1720 N Albany Ave
- 1710 N Albany Ave Unit 1
- 1706 N Albany Ave
- 1724 N Albany Ave
- 1724 N Albany Ave
- 1704 N Albany Ave
- 1728 N Albany Ave
- 1728 N Albany Ave
- 1715 N Troy St
- 1711 N Troy St
- 3100 W Wabansia Ave Unit 1
- 3100 W Wabansia Ave Unit 2
- 3100 W Wabansia Ave Unit 3