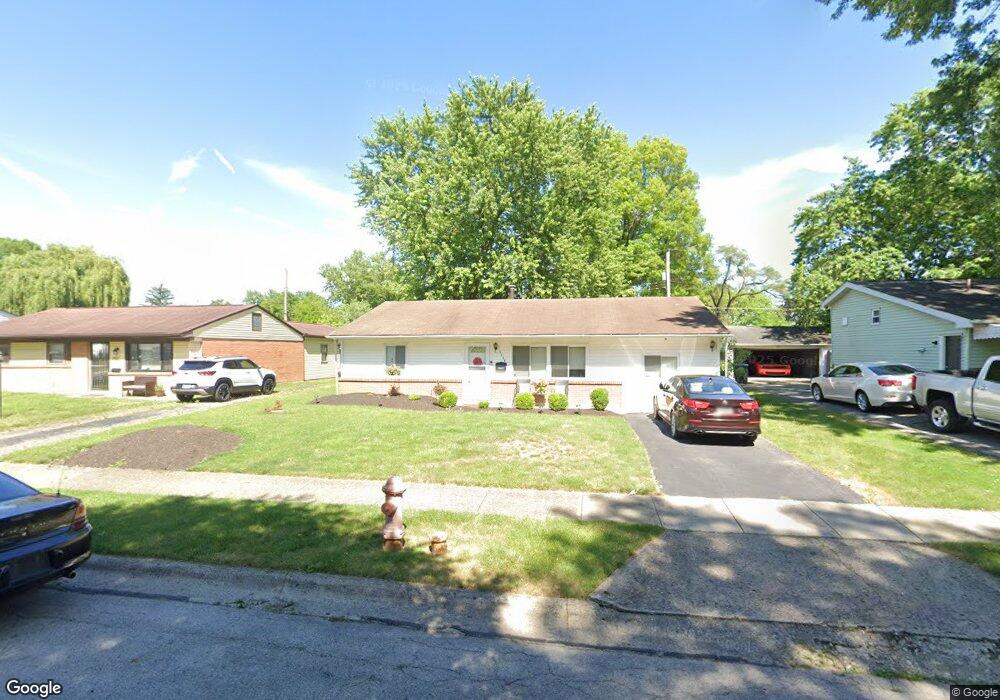
1716 Niagara Rd Columbus, OH 43227
Linwood NeighborhoodEstimated Value: $157,000 - $201,000
3
Beds
1
Bath
1,232
Sq Ft
$148/Sq Ft
Est. Value
About This Home
This home is located at 1716 Niagara Rd, Columbus, OH 43227 and is currently estimated at $181,798, approximately $147 per square foot. 1716 Niagara Rd is a home located in Franklin County with nearby schools including Scottwood Elementary School, Johnson Park Middle School, and Walnut Ridge High School.
Ownership History
Date
Name
Owned For
Owner Type
Purchase Details
Closed on
May 3, 2017
Sold by
Keehl Robert E
Bought by
Jr Rental Homes Llc
Current Estimated Value
Purchase Details
Closed on
Nov 10, 2009
Sold by
Us Bank Na
Bought by
Keehl Robert E
Purchase Details
Closed on
Oct 15, 2009
Sold by
Brown Patricia M and Case #08Cve 07 010189
Bought by
Us Bank Na
Purchase Details
Closed on
Sep 30, 1999
Sold by
Chrisman Rosemary H and Hanning Rosemary
Bought by
Brown Patricia M
Home Financials for this Owner
Home Financials are based on the most recent Mortgage that was taken out on this home.
Original Mortgage
$68,650
Interest Rate
7.93%
Mortgage Type
FHA
Purchase Details
Closed on
Feb 5, 1997
Sold by
Chrisman Gary and Chrisman Rosemary H
Bought by
Chrisman Rosemary
Purchase Details
Closed on
Jan 17, 1990
Purchase Details
Closed on
Jan 21, 1988
Create a Home Valuation Report for This Property
The Home Valuation Report is an in-depth analysis detailing your home's value as well as a comparison with similar homes in the area
Home Values in the Area
Average Home Value in this Area
Purchase History
| Date | Buyer | Sale Price | Title Company |
|---|---|---|---|
| Jr Rental Homes Llc | -- | None Available | |
| Keehl Robert E | $21,000 | Progressiv | |
| Us Bank Na | $52,000 | None Available | |
| Brown Patricia M | $69,300 | Chicago Title West | |
| Chrisman Rosemary | -- | -- | |
| -- | $52,000 | -- | |
| -- | $27,000 | -- |
Source: Public Records
Mortgage History
| Date | Status | Borrower | Loan Amount |
|---|---|---|---|
| Previous Owner | Brown Patricia M | $68,650 |
Source: Public Records
Tax History
| Year | Tax Paid | Tax Assessment Tax Assessment Total Assessment is a certain percentage of the fair market value that is determined by local assessors to be the total taxable value of land and additions on the property. | Land | Improvement |
|---|---|---|---|---|
| 2025 | $2,385 | $52,050 | $14,000 | $38,050 |
| 2024 | $2,385 | $52,050 | $14,000 | $38,050 |
| 2023 | $2,356 | $52,045 | $14,000 | $38,045 |
| 2022 | $1,321 | $24,850 | $7,560 | $17,290 |
| 2021 | $1,323 | $24,850 | $7,560 | $17,290 |
| 2020 | $1,325 | $24,850 | $7,560 | $17,290 |
| 2019 | $1,282 | $20,620 | $6,300 | $14,320 |
| 2018 | $1,263 | $20,620 | $6,300 | $14,320 |
| 2017 | $1,282 | $20,620 | $6,300 | $14,320 |
| 2016 | $1,368 | $20,130 | $4,900 | $15,230 |
| 2015 | $1,245 | $20,130 | $4,900 | $15,230 |
| 2014 | $1,248 | $20,130 | $4,900 | $15,230 |
| 2013 | $683 | $22,330 | $5,425 | $16,905 |
Source: Public Records
Map
Nearby Homes
- 1679 Penfield Rd
- 1637 S James Rd
- 3064 Niagara Ct E
- 2840 Manola Dr
- 1677 Kenview Rd
- 3325 E Deshler Ave
- 3285 Scottwood Rd
- 2731 Sonata Dr
- 1455 Wilmore Dr
- 2942 Arrowhead Ct
- 1341 Millerdale Rd
- 3038 Wadsworth Ct
- 2639 Halleck Dr
- 3036 Wadsworth Ct
- 3428 LIV Moor Dr
- 2956 Castlewood Rd
- 1353 Barnett Rd
- 2669 Berwick Blvd
- 0 Rotunda Dr Unit 271
- 1836 Penfield Ct S
- 1702 Niagara Rd
- 1722 Niagara Rd
- 1728 Niagara Rd
- 1694 Niagara Rd
- 1719 Quigley Rd
- 1727 Quigley Rd
- 1711 Quigley Rd
- 1711 Niagara Rd
- 1735 Quigley Rd
- 1703 Niagara Rd
- 1686 Niagara Rd
- 1719 Niagara Rd
- 1736 Niagara Rd
- 1695 Niagara Rd
- 1727 Niagara Rd
- 1695 Quigley Rd
- 1743 Quigley Rd
- 1744 Niagara Rd
- 1678 Niagara Rd
- 1687 Niagara Rd
Your Personal Tour Guide
Ask me questions while you tour the home.