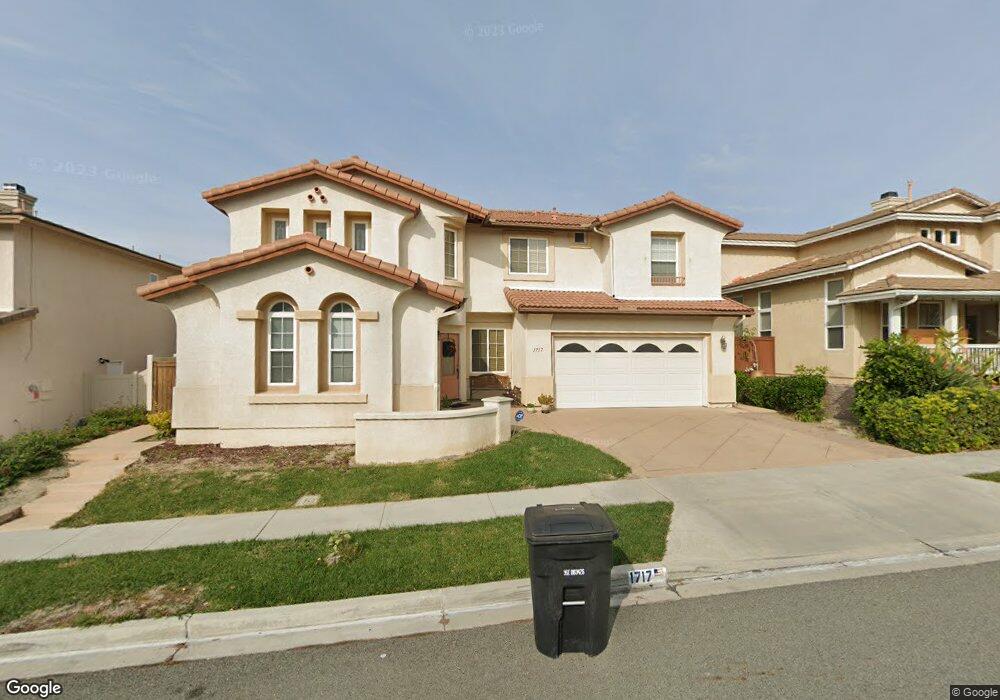
1717 Bridlevale Chula Vista, CA 91913
Otay Ranch Village NeighborhoodEstimated Value: $965,920 - $1,058,000
4
Beds
3
Baths
2,454
Sq Ft
$418/Sq Ft
Est. Value
About This Home
This home is located at 1717 Bridlevale, Chula Vista, CA 91913 and is currently estimated at $1,024,730, approximately $417 per square foot. 1717 Bridlevale is a home located in San Diego County with nearby schools including Corky McMillin Elementary School, Rancho Del Rey Middle School, and Olympian High School.
Ownership History
Date
Name
Owned For
Owner Type
Purchase Details
Closed on
Jul 19, 2010
Sold by
Padilla Benjamin N
Bought by
Fuliga Sedrick R and Fuliga Simmone R
Current Estimated Value
Home Financials for this Owner
Home Financials are based on the most recent Mortgage that was taken out on this home.
Original Mortgage
$417,000
Outstanding Balance
$276,130
Interest Rate
4.65%
Mortgage Type
VA
Estimated Equity
$748,600
Purchase Details
Closed on
Sep 16, 2004
Sold by
Battle James P and Battle Patricia A
Bought by
Padilla Benjamin N
Home Financials for this Owner
Home Financials are based on the most recent Mortgage that was taken out on this home.
Original Mortgage
$550,400
Interest Rate
5.87%
Mortgage Type
New Conventional
Purchase Details
Closed on
Mar 11, 2002
Sold by
Otay Veranda 87 Llc
Bought by
Battle James P and Battle Patricia A
Home Financials for this Owner
Home Financials are based on the most recent Mortgage that was taken out on this home.
Original Mortgage
$300,000
Interest Rate
6.78%
Create a Home Valuation Report for This Property
The Home Valuation Report is an in-depth analysis detailing your home's value as well as a comparison with similar homes in the area
Home Values in the Area
Average Home Value in this Area
Purchase History
| Date | Buyer | Sale Price | Title Company |
|---|---|---|---|
| Fuliga Sedrick R | $418,000 | Chicago Title Company | |
| Padilla Benjamin N | $688,000 | Commonwealth Land Title Co | |
| Padilla Benjamin N | -- | Commonwealth Land Title Co | |
| Battle James P | $400,000 | First American Title Ins Co |
Source: Public Records
Mortgage History
| Date | Status | Borrower | Loan Amount |
|---|---|---|---|
| Open | Fuliga Sedrick R | $417,000 | |
| Previous Owner | Padilla Benjamin N | $550,400 | |
| Previous Owner | Battle James P | $300,000 | |
| Closed | Padilla Benjamin N | $68,800 |
Source: Public Records
Tax History Compared to Growth
Tax History
| Year | Tax Paid | Tax Assessment Tax Assessment Total Assessment is a certain percentage of the fair market value that is determined by local assessors to be the total taxable value of land and additions on the property. | Land | Improvement |
|---|---|---|---|---|
| 2025 | $5,080 | $535,518 | $230,606 | $304,912 |
| 2024 | $5,080 | $525,019 | $226,085 | $298,934 |
| 2023 | $8,871 | $514,725 | $221,652 | $293,073 |
| 2022 | $8,612 | $504,633 | $217,306 | $287,327 |
| 2021 | $8,443 | $494,740 | $213,046 | $281,694 |
| 2020 | $8,256 | $489,668 | $210,862 | $278,806 |
| 2019 | $8,064 | $480,068 | $206,728 | $273,340 |
| 2018 | $7,934 | $470,656 | $202,675 | $267,981 |
| 2017 | $7,790 | $461,428 | $198,701 | $262,727 |
| 2016 | $7,604 | $452,381 | $194,805 | $257,576 |
| 2015 | $7,515 | $445,586 | $191,879 | $253,707 |
| 2014 | $7,488 | $436,859 | $188,121 | $248,738 |
Source: Public Records
Map
Nearby Homes
- 1733 Mendota St
- 1757 Via Capri
- 1626 Coolsprings Ct
- 1153 Gustine St
- 1781 Camino Strava Unit 1
- 1719 Avenida Tealing Unit 2
- 1711 Avenida Tealing
- 1760 E Palomar St Unit 111
- 1567 Apache Dr Unit A
- 1306 Mill Valley Rd
- 1567 Pleasanton Rd
- 1532 Apache Dr Unit D
- 1579 Apache Dr Unit E
- 1908 Petaluma Dr
- 1529 Apache Dr Unit A
- 1655 Deer Peak Ct
- 779 Caminito Francisco Unit 1
- 1279 Fools Gold Way Unit 2
- 1285 Fools Gold Way Unit 2
- 1761 Harvard St
- 1721 Bridlevale
- 1713 Bridlevale
- 1714 Ravenrock Ct
- 1720 Ravenrock Ct
- 1709 Bridlevale
- 1725 Bridlevale
- 1726 Ravenrock Ct
- 1718 Bridlevale Unit 4
- 1706 Ravenrock Ct
- 1714 Bridlevale Unit R23
- 1722 Bridlevale
- 1729 Bridlevale
- 1710 Bridlevale
- 1705 Bridlevale Unit R23
- 1726 Bridlevale
- 1730 Ravenrock Ct
- 1702 Ravenrock Ct
- 1717 Ravenrock Ct
- 1713 Ravenrock Ct
- 1706 Bridlevale Unit 4R23