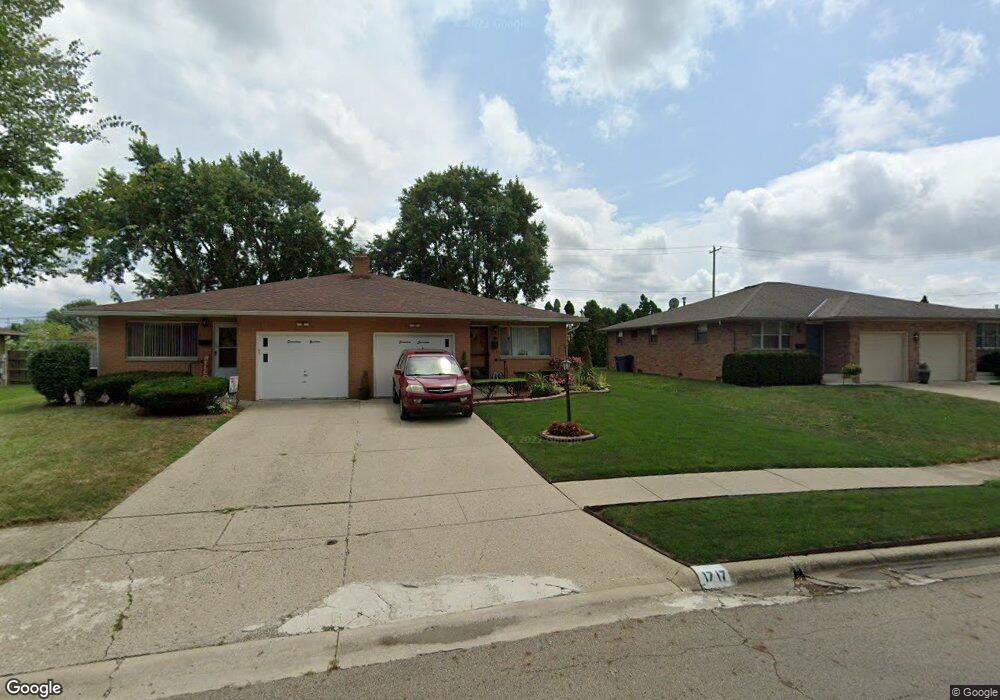
1717 Durbridge Rd Columbus, OH 43229
Northgate NeighborhoodEstimated Value: $310,000 - $360,000
4
Beds
2
Baths
2,064
Sq Ft
$162/Sq Ft
Est. Value
About This Home
This home is located at 1717 Durbridge Rd, Columbus, OH 43229 and is currently estimated at $334,507, approximately $162 per square foot. 1717 Durbridge Rd is a home located in Franklin County with nearby schools including Alpine Elementary School, Northgate Intermediate, and Woodward Park Middle School.
Ownership History
Date
Name
Owned For
Owner Type
Purchase Details
Closed on
Mar 28, 2008
Sold by
Barnes Gregory G and Barnes Marjorie E
Bought by
Barnes Properties & Investments Llc
Current Estimated Value
Home Financials for this Owner
Home Financials are based on the most recent Mortgage that was taken out on this home.
Original Mortgage
$144,250
Outstanding Balance
$89,598
Interest Rate
5.6%
Mortgage Type
Purchase Money Mortgage
Estimated Equity
$244,909
Purchase Details
Closed on
Oct 15, 2004
Sold by
Ullom Glenn E and Ullom Thelma I
Bought by
Barnes Gregory G and Barnes Marjorie E
Home Financials for this Owner
Home Financials are based on the most recent Mortgage that was taken out on this home.
Original Mortgage
$144,000
Interest Rate
6%
Mortgage Type
Purchase Money Mortgage
Purchase Details
Closed on
Jan 20, 2003
Sold by
Ullom Glenn E and Ullom Thelma I
Bought by
Ullom Glenn E and Ullom Thelma L
Purchase Details
Closed on
Aug 16, 1968
Bought by
Ullom Glenn E and Ullom Thelma I
Create a Home Valuation Report for This Property
The Home Valuation Report is an in-depth analysis detailing your home's value as well as a comparison with similar homes in the area
Home Values in the Area
Average Home Value in this Area
Purchase History
| Date | Buyer | Sale Price | Title Company |
|---|---|---|---|
| Barnes Properties & Investments Llc | -- | Expedient | |
| Barnes Gregory G | $180,000 | -- | |
| Ullom Glenn E | -- | -- | |
| Ullom Glenn E | -- | -- |
Source: Public Records
Mortgage History
| Date | Status | Borrower | Loan Amount |
|---|---|---|---|
| Open | Barnes Properties & Investments Llc | $144,250 | |
| Previous Owner | Barnes Gregory G | $144,000 | |
| Closed | Barnes Gregory G | $18,000 |
Source: Public Records
Tax History Compared to Growth
Tax History
| Year | Tax Paid | Tax Assessment Tax Assessment Total Assessment is a certain percentage of the fair market value that is determined by local assessors to be the total taxable value of land and additions on the property. | Land | Improvement |
|---|---|---|---|---|
| 2024 | $4,567 | $99,650 | $23,140 | $76,510 |
| 2023 | $4,510 | $99,650 | $23,140 | $76,510 |
| 2022 | $2,965 | $55,800 | $12,920 | $42,880 |
| 2021 | $2,971 | $55,800 | $12,920 | $42,880 |
| 2020 | $2,975 | $55,800 | $12,920 | $42,880 |
| 2019 | $2,775 | $44,630 | $10,330 | $34,300 |
| 2018 | $2,795 | $44,630 | $10,330 | $34,300 |
| 2017 | $2,935 | $44,630 | $10,330 | $34,300 |
| 2016 | $3,096 | $45,570 | $10,290 | $35,280 |
| 2015 | $2,819 | $45,570 | $10,290 | $35,280 |
| 2014 | $2,825 | $45,570 | $10,290 | $35,280 |
| 2013 | $1,549 | $50,645 | $11,445 | $39,200 |
Source: Public Records
Map
Nearby Homes
- 6035 Karl Rd
- 1752 Pine Tree St S Unit H
- 1743 Pine Tree St N Unit A
- 1549 Alpine Dr
- 6019 Beechcroft Rd
- 1687 Brookfield Square S
- 1390 E Dublin Granville Rd
- 1881 Brimfield Rd
- 5732 Beechcroft Rd Unit B
- 5726 Beechcroft Rd Unit J
- 6342 Bellmeadow Dr
- 1492 Cottonwood Dr
- 1722 Blue Ash Place
- 6245 Sharon Woods Blvd
- 1288 Oakfield Dr N
- 5485 Tamarack Blvd
- 1914 Walden Dr
- 6407 Skywae Dr
- 2250 Webster Canyon Ct
- 6458 Faircrest Rd
- 1709 Durbridge Rd Unit 711
- 1699 Durbridge Rd Unit 701
- 1722-1724 Durbridge Rd
- 1722 Durbridge Rd Unit 724
- 1712-1714 Durbridge Rd
- 1712 Durbridge Rd Unit 714
- 1734-1736 Durbridge Rd
- 1734 Durbridge Rd Unit 736
- 1689 Durbridge Rd Unit 691
- 1700 Durbridge Rd Unit 702
- 1742 Durbridge Rd Unit 744
- 1690 Durbridge Rd Unit 692
- 1681 Durbridge Rd Unit 683
- 1717 Sandhurst Rd
- 1707 Sandhurst Rd
- 1755 Lynnhurst Rd Unit 757
- 1682 Durbridge Rd Unit 684
- 1727 Sandhurst Rd
- 1699 Sandhurst Rd
- 1669 Durbridge Rd Unit 671