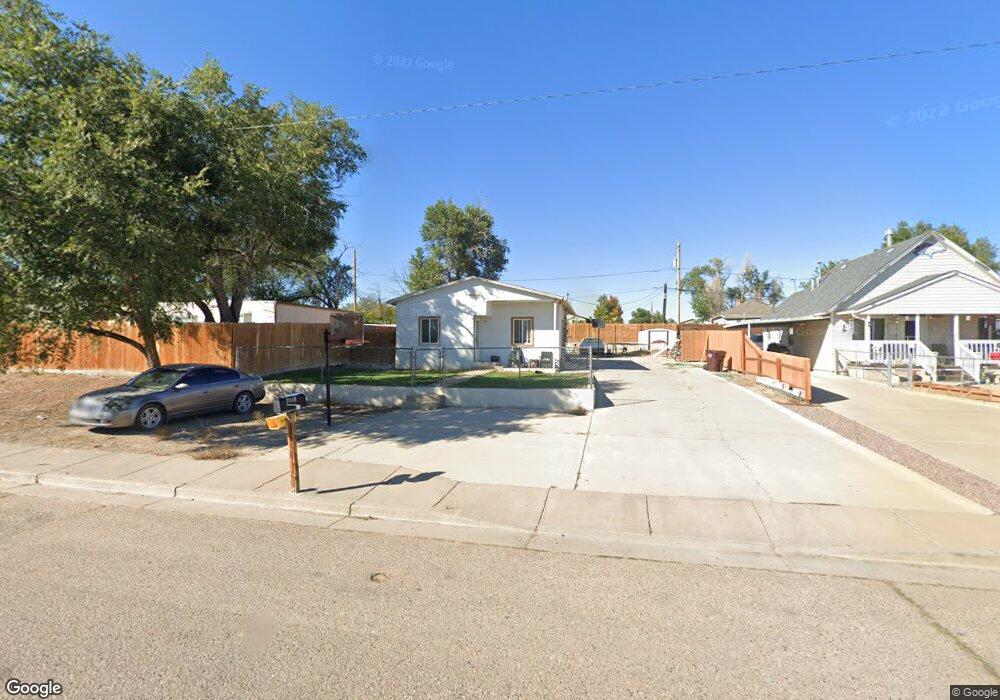
1717 E Ash St Pueblo, CO 81001
Lower East Side NeighborhoodEstimated Value: $118,000 - $164,000
1
Bed
1
Bath
662
Sq Ft
$219/Sq Ft
Est. Value
About This Home
This home is located at 1717 E Ash St, Pueblo, CO 81001 and is currently estimated at $145,255, approximately $219 per square foot. 1717 E Ash St is a home located in Pueblo County with nearby schools including Bradford Elementary School, Risley International Academy of Innovation, and East High School.
Ownership History
Date
Name
Owned For
Owner Type
Purchase Details
Closed on
Oct 22, 2015
Sold by
Sisneros Salomon and Sisneros Peggy L
Bought by
Haro Theresa
Current Estimated Value
Purchase Details
Closed on
Jan 24, 2015
Sold by
Sisneros Salomon and Sena Richard Vincent
Bought by
Sisneros Salomon and Sisneros Peggy L
Purchase Details
Closed on
Jan 22, 2015
Sold by
Sisneros Salomon
Bought by
Sisneros Salomon and Sisneros Peggy L
Purchase Details
Closed on
Nov 19, 2014
Sold by
Sena Loyola
Bought by
Sisneros Salomon
Purchase Details
Closed on
Jun 17, 2008
Sold by
Sena Loyola
Bought by
Sena Loyola and Sena Richard Vincent
Purchase Details
Closed on
Jun 6, 2008
Sold by
Sena Loyola
Bought by
Sena Loyola
Purchase Details
Closed on
Jun 23, 1986
Sold by
Sisneros Eldifonso + Angie
Bought by
Sisneros Eldifonso + Angie
Purchase Details
Closed on
Nov 26, 1974
Sold by
Nt
Bought by
Sisneros Eldifonso + Angie
Create a Home Valuation Report for This Property
The Home Valuation Report is an in-depth analysis detailing your home's value as well as a comparison with similar homes in the area
Home Values in the Area
Average Home Value in this Area
Purchase History
| Date | Buyer | Sale Price | Title Company |
|---|---|---|---|
| Haro Theresa | $20,000 | None Available | |
| Sisneros Salomon | -- | None Available | |
| Sisneros Salomon | -- | None Available | |
| Sisneros Salomon | -- | None Available | |
| Sena Loyola | -- | None Available | |
| Sena Loyola | -- | None Available | |
| Sisneros Eldifonso + Angie | -- | -- | |
| Sisneros Eldifonso + Angie | $1,000 | -- |
Source: Public Records
Tax History Compared to Growth
Tax History
| Year | Tax Paid | Tax Assessment Tax Assessment Total Assessment is a certain percentage of the fair market value that is determined by local assessors to be the total taxable value of land and additions on the property. | Land | Improvement |
|---|---|---|---|---|
| 2024 | $423 | $4,260 | -- | -- |
| 2023 | $428 | $7,950 | $1,010 | $6,940 |
| 2022 | $401 | $4,040 | $460 | $3,580 |
| 2021 | $414 | $4,160 | $480 | $3,680 |
| 2020 | $301 | $4,160 | $480 | $3,680 |
| 2019 | $301 | $2,984 | $215 | $2,769 |
| 2018 | $199 | $2,191 | $216 | $1,975 |
| 2017 | $201 | $2,191 | $216 | $1,975 |
| 2016 | $190 | $2,090 | $239 | $1,851 |
| 2015 | $95 | $2,090 | $239 | $1,851 |
| 2014 | $222 | $2,443 | $239 | $2,204 |
Source: Public Records
Map
Nearby Homes