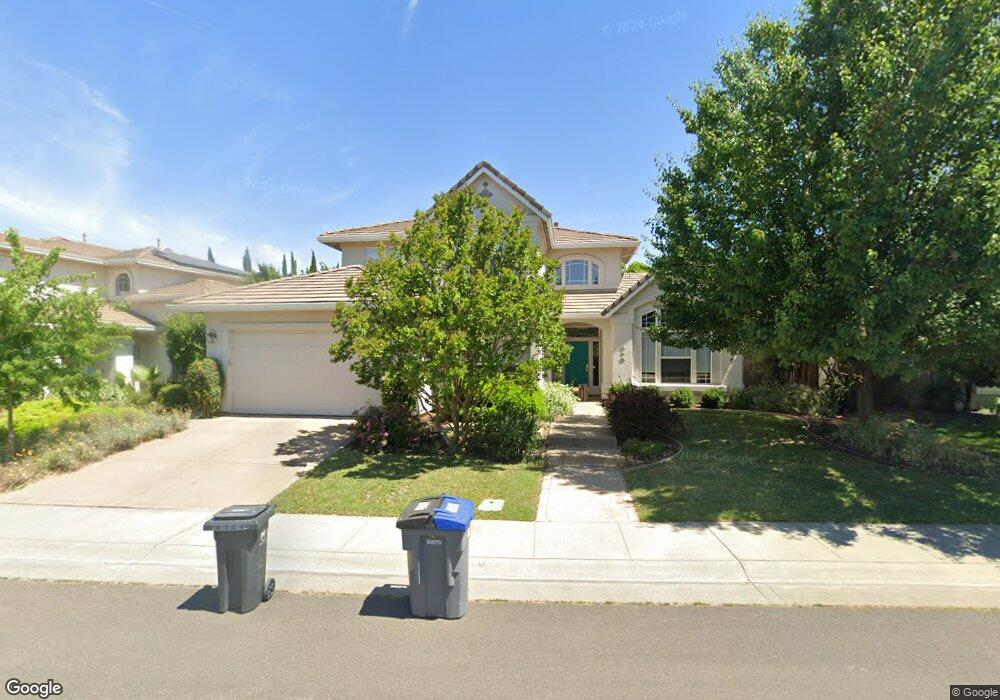
1717 Hampton Dr Davis, CA 95616
West Davis NeighborhoodEstimated Value: $1,074,000 - $1,179,000
4
Beds
3
Baths
2,881
Sq Ft
$390/Sq Ft
Est. Value
About This Home
This home is located at 1717 Hampton Dr, Davis, CA 95616 and is currently estimated at $1,123,762, approximately $390 per square foot. 1717 Hampton Dr is a home located in Yolo County with nearby schools including Robert E. Willett Elementary School, Ralph Waldo Emerson Junior High School, and Davis Senior High School.
Ownership History
Date
Name
Owned For
Owner Type
Purchase Details
Closed on
Oct 27, 2009
Sold by
Wisner Erik R and Gardner Gina
Bought by
Wisner Erik R and Gardner Gina
Current Estimated Value
Purchase Details
Closed on
Jul 6, 2000
Sold by
Monley Cronin Construction Co
Bought by
Wisner Erik R and Gardner Gina
Home Financials for this Owner
Home Financials are based on the most recent Mortgage that was taken out on this home.
Original Mortgage
$320,000
Outstanding Balance
$117,100
Interest Rate
8.55%
Estimated Equity
$1,006,662
Purchase Details
Closed on
Sep 15, 1999
Sold by
Davis Land Development Ltd
Bought by
Monley Cronin Construction Co
Home Financials for this Owner
Home Financials are based on the most recent Mortgage that was taken out on this home.
Original Mortgage
$68,250
Interest Rate
7.89%
Create a Home Valuation Report for This Property
The Home Valuation Report is an in-depth analysis detailing your home's value as well as a comparison with similar homes in the area
Home Values in the Area
Average Home Value in this Area
Purchase History
| Date | Buyer | Sale Price | Title Company |
|---|---|---|---|
| Wisner Erik R | -- | None Available | |
| Wisner Erik R | $419,500 | Placer Title Company | |
| Monley Cronin Construction Co | $105,500 | Placer Title Company |
Source: Public Records
Mortgage History
| Date | Status | Borrower | Loan Amount |
|---|---|---|---|
| Open | Wisner Erik R | $320,000 | |
| Previous Owner | Monley Cronin Construction Co | $68,250 |
Source: Public Records
Tax History
| Year | Tax Paid | Tax Assessment Tax Assessment Total Assessment is a certain percentage of the fair market value that is determined by local assessors to be the total taxable value of land and additions on the property. | Land | Improvement |
|---|---|---|---|---|
| 2025 | $9,093 | $632,099 | $203,413 | $428,686 |
| 2023 | $9,093 | $607,556 | $195,515 | $412,041 |
| 2022 | $8,752 | $595,644 | $191,682 | $403,962 |
| 2021 | $8,571 | $583,966 | $187,924 | $396,042 |
| 2020 | $8,441 | $577,980 | $185,998 | $391,982 |
| 2019 | $8,114 | $566,648 | $182,351 | $384,297 |
| 2018 | $7,618 | $555,538 | $178,776 | $376,762 |
| 2017 | $7,481 | $544,646 | $175,271 | $369,375 |
| 2016 | $7,289 | $533,968 | $171,835 | $362,133 |
| 2015 | $7,070 | $525,948 | $169,254 | $356,694 |
| 2014 | $7,070 | $515,646 | $165,939 | $349,707 |
Source: Public Records
Map
Nearby Homes
- 1211 Arthur St
- 1418 Yukon St
- 1837 Tahoe Place
- 1427 Brown Dr
- 1651 Joshua Tree St
- 1013 Plum Ln
- 1018 Plum Ln
- 638 Arthur St Unit 640
- 1560 Drake Dr
- 1114 Purdue Dr
- 2144 Calaveras Ave
- 2216 Bryce Ln
- 1577 Drake Dr
- 3360 Houser Ct
- 3368 Houser Ct
- 3303 Houser Ct
- 1932 Chasen Ln
- 36100 Russell Blvd
- 2406 Overhill Ln
- 916-918 Drake Dr
- 1711 Hampton Dr
- 1723 Hampton Dr
- 1705 Hampton Dr
- 1706 van Damme Dr
- 1729 Hampton Dr
- 1712 van Damme Dr
- 1700 van Damme Dr
- 1718 van Damme Dr
- 1633 Hampton Dr
- 1735 Hampton Dr
- 1626 van Damme Dr
- 1724 van Damme Dr
- 1627 Hampton Dr
- 1741 Hampton Dr
- 1707 van Damme Dr
- 1620 van Damme Dr
- 1713 van Damme Dr
- 1223 Arthur St
- 1621 Hampton Dr
- 1623 van Damme Dr
Your Personal Tour Guide
Ask me questions while you tour the home.