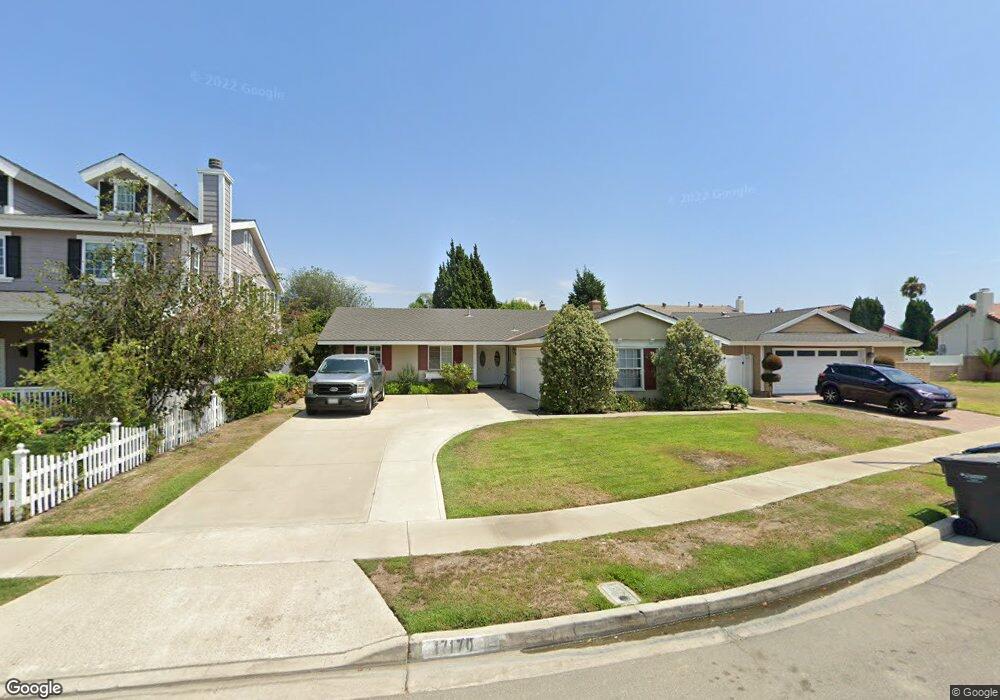
17170 Apricot Cir Fountain Valley, CA 92708
Estimated Value: $1,270,928 - $1,521,000
4
Beds
2
Baths
1,519
Sq Ft
$918/Sq Ft
Est. Value
About This Home
This home is located at 17170 Apricot Cir, Fountain Valley, CA 92708 and is currently estimated at $1,393,982, approximately $917 per square foot. 17170 Apricot Cir is a home located in Orange County with nearby schools including Plavan (Urbain H.) Elementary School, Masuda (Kazuo) Middle School, and Fountain Valley High School.
Ownership History
Date
Name
Owned For
Owner Type
Purchase Details
Closed on
Sep 24, 2010
Sold by
Hopkins Travis and Hopkins Jennifer
Bought by
Hopkins Travis and Hopkins Jennifer
Current Estimated Value
Home Financials for this Owner
Home Financials are based on the most recent Mortgage that was taken out on this home.
Original Mortgage
$250,000
Outstanding Balance
$163,737
Interest Rate
4.28%
Mortgage Type
New Conventional
Estimated Equity
$1,230,245
Purchase Details
Closed on
Mar 27, 2001
Sold by
Chang Wen Ho and Chang Shi Hui
Bought by
Hopkins Travis K and Hopkins Jennifer L
Home Financials for this Owner
Home Financials are based on the most recent Mortgage that was taken out on this home.
Original Mortgage
$254,450
Interest Rate
7.06%
Create a Home Valuation Report for This Property
The Home Valuation Report is an in-depth analysis detailing your home's value as well as a comparison with similar homes in the area
Home Values in the Area
Average Home Value in this Area
Purchase History
| Date | Buyer | Sale Price | Title Company |
|---|---|---|---|
| Hopkins Travis | -- | Nations Title Co | |
| Hopkins Travis K | $320,500 | Commonwealth Land Title |
Source: Public Records
Mortgage History
| Date | Status | Borrower | Loan Amount |
|---|---|---|---|
| Open | Hopkins Travis | $250,000 | |
| Closed | Hopkins Travis K | $254,450 | |
| Closed | Hopkins Travis K | $50,000 |
Source: Public Records
Tax History Compared to Growth
Tax History
| Year | Tax Paid | Tax Assessment Tax Assessment Total Assessment is a certain percentage of the fair market value that is determined by local assessors to be the total taxable value of land and additions on the property. | Land | Improvement |
|---|---|---|---|---|
| 2025 | $5,495 | $482,935 | $377,632 | $105,303 |
| 2024 | $5,495 | $473,466 | $370,227 | $103,239 |
| 2023 | $5,365 | $464,183 | $362,968 | $101,215 |
| 2022 | $5,286 | $455,082 | $355,851 | $99,231 |
| 2021 | $5,185 | $446,159 | $348,873 | $97,286 |
| 2020 | $5,155 | $441,585 | $345,296 | $96,289 |
| 2019 | $5,051 | $432,927 | $338,526 | $94,401 |
| 2018 | $4,955 | $424,439 | $331,889 | $92,550 |
| 2017 | $4,878 | $416,117 | $325,381 | $90,736 |
| 2016 | $4,670 | $407,958 | $319,001 | $88,957 |
| 2015 | $4,600 | $401,831 | $314,210 | $87,621 |
| 2014 | $4,509 | $393,960 | $308,055 | $85,905 |
Source: Public Records
Map
Nearby Homes
- 17215 Buttonwood St
- 17333 Brookhurst St Unit B7
- 17333 Brookhurst St Unit D6
- 16806 Olive St
- 16767 Madrone Cir
- 9446 Gardenia Ave
- 10322 Avenida Cinco de Mayo
- 9485 Geranium Cir
- 16379 Shadbush St
- 10452 Circulo de Juarez
- 17071 Ward St
- 17807 Joshua Cir
- 109 Pigeon Ln
- 109 Pigeon Ln Unit 109
- 202 Pigeon Ln
- 108 Pigeon Ln
- 110 Sumac Ln
- 16871 Ross Ln
- 112 Parrot Ln
- 259 Albatross Ln
- 17160 Apricot Cir
- 17180 Apricot Cir
- 17137 Sparkleberry St
- 17121 Sparkleberry St
- 17150 Apricot Cir
- 17151 Sparkleberry St
- 17190 Apricot Cir
- 17167 Apricot Cir
- 17171 Apricot Cir
- 17111 Sparkleberry St
- 17169 Sparkleberry St
- 9598 El Tambor Ave
- 17142 Apricot Cir
- 17155 Apricot Cir
- 9588 El Tambor Ave
- 17181 Sparkleberry St
- 9621 La Esperanza Ave
- 17130 Apricot Cir
- 9639 La Mora Cir
- 17143 Apricot Cir