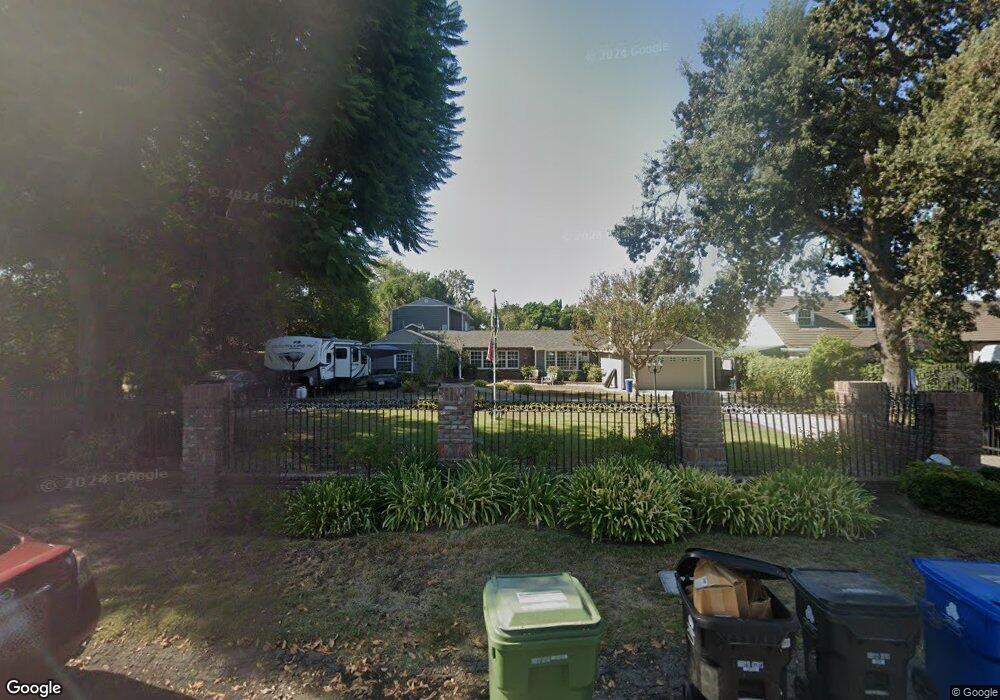
17170 Rayen St Northridge, CA 91325
Estimated Value: $1,784,000 - $2,344,000
4
Beds
5
Baths
3,364
Sq Ft
$597/Sq Ft
Est. Value
About This Home
This home is located at 17170 Rayen St, Northridge, CA 91325 and is currently estimated at $2,008,727, approximately $597 per square foot. 17170 Rayen St is a home located in Los Angeles County with nearby schools including Oliver Wendell Holmes Middle School, Northridge Academy High, and James Monroe High School.
Ownership History
Date
Name
Owned For
Owner Type
Purchase Details
Closed on
Jul 20, 2004
Sold by
Lovullo Torey and Lovullo Lynn
Bought by
Kim Andrew
Current Estimated Value
Home Financials for this Owner
Home Financials are based on the most recent Mortgage that was taken out on this home.
Original Mortgage
$664,300
Interest Rate
5.12%
Mortgage Type
Purchase Money Mortgage
Purchase Details
Closed on
Feb 18, 1999
Sold by
Hubbard Family Trust Hubbard Peter L And Jean
Bought by
Lovullo Torey
Home Financials for this Owner
Home Financials are based on the most recent Mortgage that was taken out on this home.
Original Mortgage
$205,000
Interest Rate
6.91%
Purchase Details
Closed on
Jul 7, 1994
Sold by
Hubbard Peter L and Hubbard Jeanine M
Bought by
Hubbard Peter L
Create a Home Valuation Report for This Property
The Home Valuation Report is an in-depth analysis detailing your home's value as well as a comparison with similar homes in the area
Home Values in the Area
Average Home Value in this Area
Purchase History
| Date | Buyer | Sale Price | Title Company |
|---|---|---|---|
| Kim Andrew | $949,000 | First Southwestern Title Com | |
| Lovullo Torey | $595,000 | First American Title Co | |
| Hubbard Peter L | -- | -- |
Source: Public Records
Mortgage History
| Date | Status | Borrower | Loan Amount |
|---|---|---|---|
| Previous Owner | Kim Andrew | $664,300 | |
| Previous Owner | Lovullo Torey | $205,000 | |
| Closed | Kim Andrew | $284,700 |
Source: Public Records
Tax History Compared to Growth
Tax History
| Year | Tax Paid | Tax Assessment Tax Assessment Total Assessment is a certain percentage of the fair market value that is determined by local assessors to be the total taxable value of land and additions on the property. | Land | Improvement |
|---|---|---|---|---|
| 2025 | $16,116 | $1,322,809 | $827,698 | $495,111 |
| 2024 | $16,116 | $1,296,872 | $811,469 | $485,403 |
| 2023 | $15,808 | $1,271,444 | $795,558 | $475,886 |
| 2022 | $15,081 | $1,246,514 | $779,959 | $466,555 |
| 2021 | $13,806 | $1,130,000 | $706,600 | $423,400 |
| 2019 | $13,028 | $1,065,000 | $666,000 | $399,000 |
| 2018 | $12,294 | $1,004,000 | $628,300 | $375,700 |
| 2016 | $10,339 | $848,000 | $531,000 | $317,000 |
| 2015 | $10,340 | $848,000 | $531,000 | $317,000 |
| 2014 | $9,844 | $787,000 | $493,000 | $294,000 |
Source: Public Records
Map
Nearby Homes
- 17153 Rayen St
- 17190 Gresham St
- 8944 Amestoy Ave
- 17350 Osborne St
- 8633 Balboa Blvd Unit 29
- 17441 Rayen St
- 8536 Oak Park Ave
- 17101 Dearborn St
- 17241 Raymer St
- 17063 Knapp St
- 17545 Parthenia St
- 16805 Rayen St
- 8383 Paso Robles Ave
- 17040 Community St
- 9218 Encino Ave
- 17437 Chase St
- 8760 White Oak Ave
- 17041 Roscoe Blvd
- 17053 Roscoe Blvd Unit 6
- 17045 Roscoe Blvd Unit 14
- 17180 Rayen St
- 17160 Rayen St
- 17200 Rayen St
- 17150 Rayen St
- 17175 Rayen St
- 17171 Gresham St
- 17210 Rayen St
- 17140 Rayen St
- 17181 Gresham St
- 17161 Gresham St
- 17173 Rayen St
- 17163 Rayen St
- 17183 Rayen St
- 17201 Gresham St
- 17151 Gresham St
- 17203 Rayen St
- 17220 Rayen St
- 17141 Gresham St
- 17141 Rayen St
- 17213 Rayen St