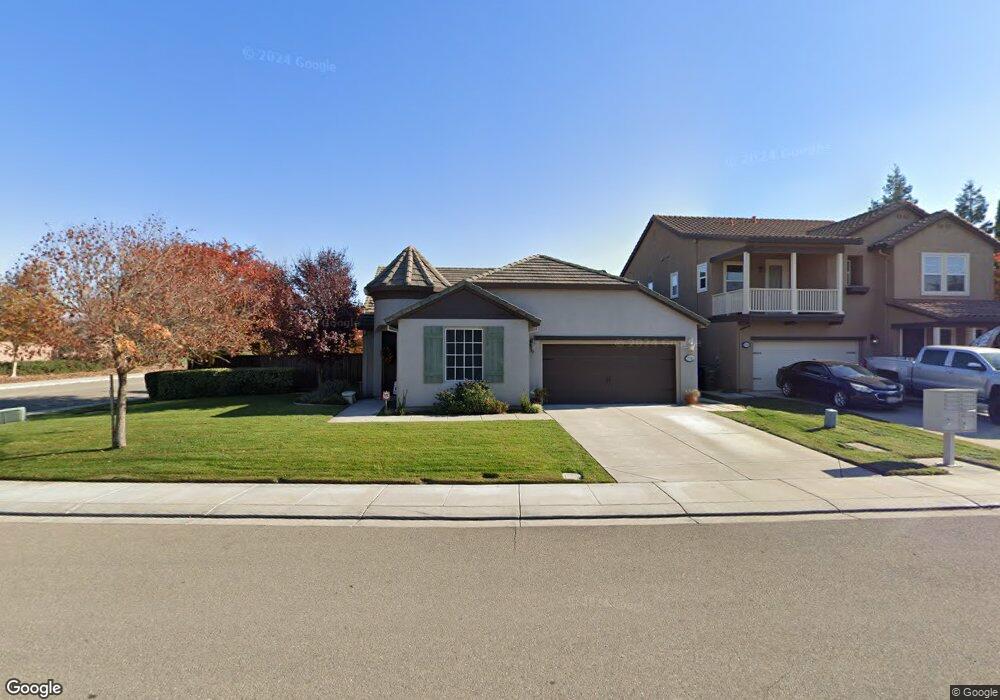
1718 Bandoni Ln Manteca, CA 95337
Estimated Value: $585,000 - $628,000
3
Beds
2
Baths
1,935
Sq Ft
$316/Sq Ft
Est. Value
About This Home
This home is located at 1718 Bandoni Ln, Manteca, CA 95337 and is currently estimated at $611,910, approximately $316 per square foot. 1718 Bandoni Ln is a home located in San Joaquin County with nearby schools including Walter Woodward Elementary School, Manteca High School, and St. Anthony's Catholic School.
Ownership History
Date
Name
Owned For
Owner Type
Purchase Details
Closed on
Dec 13, 2016
Sold by
Williams Brian A and Williams Sara A
Bought by
Williams Brian A and Williams Sara A
Current Estimated Value
Purchase Details
Closed on
Mar 18, 2011
Sold by
Federal National Mortgage Association
Bought by
Williams Brian A and Williams Sara A
Home Financials for this Owner
Home Financials are based on the most recent Mortgage that was taken out on this home.
Original Mortgage
$223,428
Outstanding Balance
$153,228
Interest Rate
4.75%
Mortgage Type
FHA
Estimated Equity
$458,682
Purchase Details
Closed on
Jan 12, 2011
Sold by
Scott Darryl A
Bought by
Federal National Mortgage Association
Purchase Details
Closed on
May 7, 2007
Sold by
Standard Pacific Corp
Bought by
Scott Darryl A
Home Financials for this Owner
Home Financials are based on the most recent Mortgage that was taken out on this home.
Original Mortgage
$326,632
Interest Rate
8.12%
Mortgage Type
New Conventional
Create a Home Valuation Report for This Property
The Home Valuation Report is an in-depth analysis detailing your home's value as well as a comparison with similar homes in the area
Home Values in the Area
Average Home Value in this Area
Purchase History
| Date | Buyer | Sale Price | Title Company |
|---|---|---|---|
| Williams Brian A | -- | None Available | |
| Williams Brian A | $229,500 | Lawyers Title Insurance Corp | |
| Federal National Mortgage Association | $413,906 | None Available | |
| Scott Darryl A | $408,500 | First Amer Title Co |
Source: Public Records
Mortgage History
| Date | Status | Borrower | Loan Amount |
|---|---|---|---|
| Open | Williams Brian A | $223,428 | |
| Previous Owner | Scott Darryl A | $326,632 |
Source: Public Records
Tax History Compared to Growth
Tax History
| Year | Tax Paid | Tax Assessment Tax Assessment Total Assessment is a certain percentage of the fair market value that is determined by local assessors to be the total taxable value of land and additions on the property. | Land | Improvement |
|---|---|---|---|---|
| 2025 | $4,580 | $293,684 | $73,022 | $220,662 |
| 2024 | $4,241 | $287,927 | $71,591 | $216,336 |
| 2023 | $4,202 | $282,283 | $70,188 | $212,095 |
| 2022 | $4,174 | $276,749 | $68,812 | $207,937 |
| 2021 | $4,139 | $271,323 | $67,463 | $203,860 |
| 2020 | $4,008 | $268,542 | $66,772 | $201,770 |
| 2019 | $3,960 | $263,277 | $65,463 | $197,814 |
| 2018 | $3,962 | $258,116 | $64,180 | $193,936 |
| 2017 | $3,904 | $253,056 | $62,922 | $190,134 |
| 2016 | $3,837 | $248,095 | $61,688 | $186,407 |
| 2014 | $3,506 | $239,583 | $59,572 | $180,011 |
Source: Public Records
Map
Nearby Homes
- 1734 Bandoni Ln
- 1271 Veteran St
- Syrah Plan at Vintage ll - Vintage II
- Merlot Plan at Vintage ll - Vintage II
- Zinfandel Plan at Vintage ll - Vintage II
- 1807 Birdie Ave
- 1294 Grafton Ct
- 1175 Miel St
- 1266 Veteran St
- 1325 Veteran St
- 1310 Veteran St
- 1076 Balzo St
- 1773 Lana Way
- 984 E Woodward Ave
- 1431 Paco Way
- 963 Grafton St
- 1455 Orgullo Ln
- 1730 Tasca Ln
- 1581 Veteran St
- 948 Monarch Ct
- 1717 Tesoro Place
- 1729 Tesoro Place
- 1748 Bandoni Ln
- 1232 Tesoro Dr
- 1743 Tesoro Place
- 1683 Tulipano Ct
- 1729 Bandoni Ln
- 1737 Bandoni Ln
- 1224 Tesoro Dr
- 1697 Tulipano Ct
- 1749 Bandoni Ln
- 1675 Tulipano Ct
- 1755 Tesoro Place
- 1212 Tesoro Dr
- 1314 Tesoro Dr
- 1730 Abeja Ln
- 1696 Tulipano Ct
- 1742 Abeja Ln
- 1669 Tulipano Ct
- 1754 Abeja Ln